


Introduction
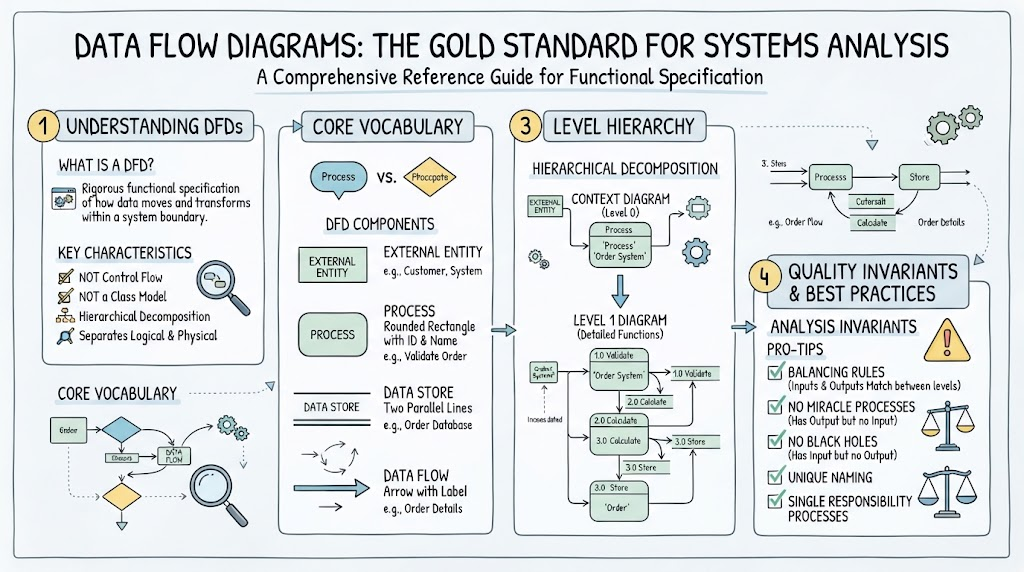
1. The Core Building Blocks: The DFD “Vocabulary”
Before diving into levels and types, you need the four fundamental symbols every DFD is made of. These are consistent across all notations (Yourdon/DeMarco, Gane & Sarson, SSADM) — they differ only in shape.
| Element | Purpose | Gane & Sarson Shape | Yourdon/DeMarco Shape |
|---|---|---|---|
| External Entity (Terminator) | A source or sink outside the system — a person, organization, or external system that supplies or consumes data | Rounded rectangle | Square / box |
| Process | Transforms inputs into outputs. Always named with a verb and numbered | Rounded rectangle | Circle (bubble) |
| Data Store | Where data is held at rest — a file, database, or repository | Open-ended rectangle | Two parallel lines |
| Data Flow | A named arrow showing data moving between elements | Arrow with label | Arrow with label |
Naming conventions (crucial for clarity):
-
Processes: numbered + verb phrase →
1.0 Validate Order,2.0 Check Inventory. The numbering is what enables decomposition (process2.0breaks into2.1,2.2,2.3…). -
Data stores: numbered + noun phrase →
D1 Customer,D2 Inventory. -
Data flows: a short descriptor of the data content →
Order Request,Payment Verification,Stock Count.
2. The Level Hierarchy (Abstraction by Decomposition)
The core idea of leveled DFDs is top-down decomposition: you start with a single opaque bubble and recursively expose its internals until each process is trivially simple.
2.1 Context Diagram (Level 0)
-
Abstraction: Highest possible — the entire system is one process.
-
What it shows: External entities, and the data flows connecting them to the single system bubble. That’s it.
-
What it deliberately hides: Every internal process, every data store, and all data flows within the system.
-
Purpose: Defines the system boundary — the crisp line between “what’s inside” and “what’s outside.”
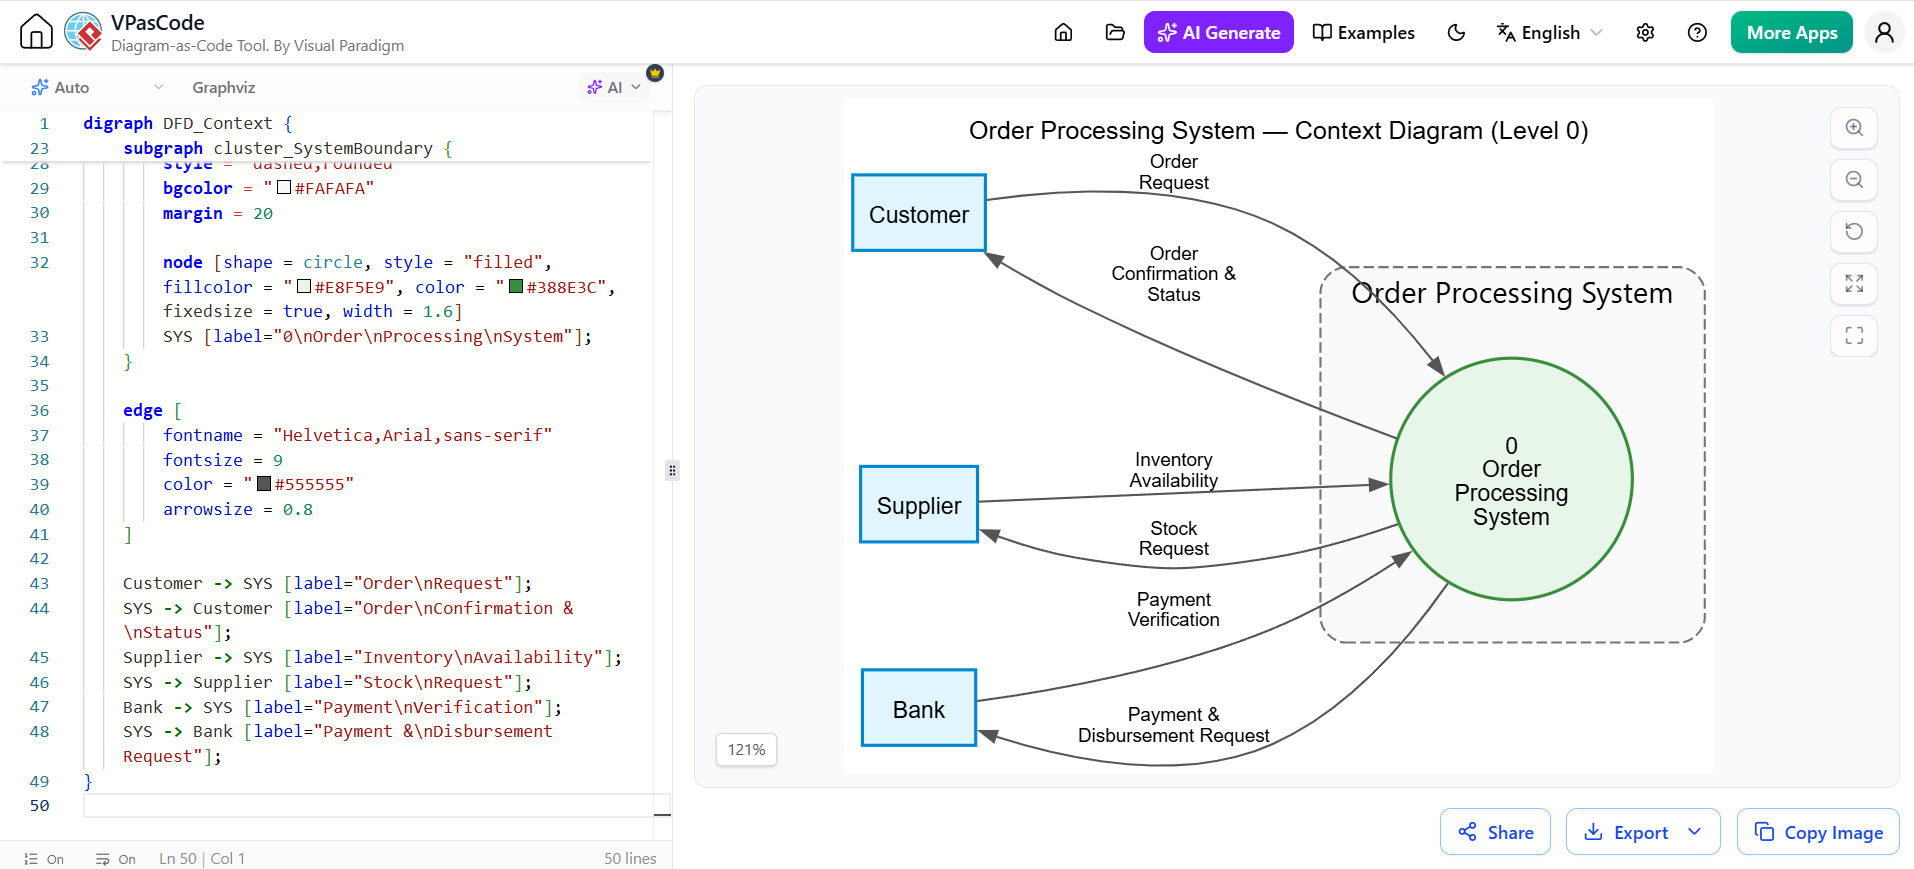
Below is a Context Diagram for an Order Processing System. Notice how the entire system appears as process 0, and all details are pushed to the external world:
digraph DFD_Context {
    graph [
        rankdir = LR
        splines = true
        overlap = false
        nodesep = 0.5
        ranksep = 1.2
        fontname = "Helvetica,Arial,sans-serif"
        fontsize = 12
        label = "Order Processing System — Context Diagram (Level 0)"
        labelloc = t
    ]

    node [
        fontname = "Helvetica,Arial,sans-serif"
        fontsize = 11
        penwidth = 1.5
    ]

    node [shape = box, style = "filled", fillcolor = "#E1F5FE", color = "#0288D1"]
    Customer; Supplier; Bank;

    subgraph cluster_SystemBoundary {
        label = "Order Processing System";
        fontname = "Helvetica,Arial,sans-serif; bold"
        fontsize = 14
        color = "#757575"
        style = "dashed,rounded"
        bgcolor = "#FAFAFA"
        margin = 20

        node [shape = circle, style = "filled", fillcolor = "#E8F5E9", color = "#388E3C", fixedsize = true, width = 1.6]
        SYS [label="0\nOrder\nProcessing\nSystem"];
    }

    edge [
        fontname = "Helvetica,Arial,sans-serif"
        fontsize = 9
        color = "#555555"
        arrowsize = 0.8
    ]

    Customer -> SYS [label="Order\nRequest"];
    SYS -> Customer [label="Order\nConfirmation &\nStatus"];
    Supplier -> SYS [label="Inventory\nAvailability"];
    SYS -> Supplier [label="Stock\nRequest"];
    Bank -> SYS [label="Payment\nVerification"];
    SYS -> Bank [label="Payment &\nDisbursement Request"];
}
Read the boundary: In this Context Diagram, the system does nothing visible — but every external interaction is enumerated. This artifact is the contract you signed with the stakeholders: it captures scope and prevents scope creep because anything not on this diagram is out of scope.
2.2 Level 1 DFD
-
Abstraction: Breaks the single
0process into its major sub-processes. -
What it shows: The primary functional areas, key data stores, and how data moves between them, the stores, and the external entities.
-
Purpose: Gives the first real view of system structure. The main functions are now visible.
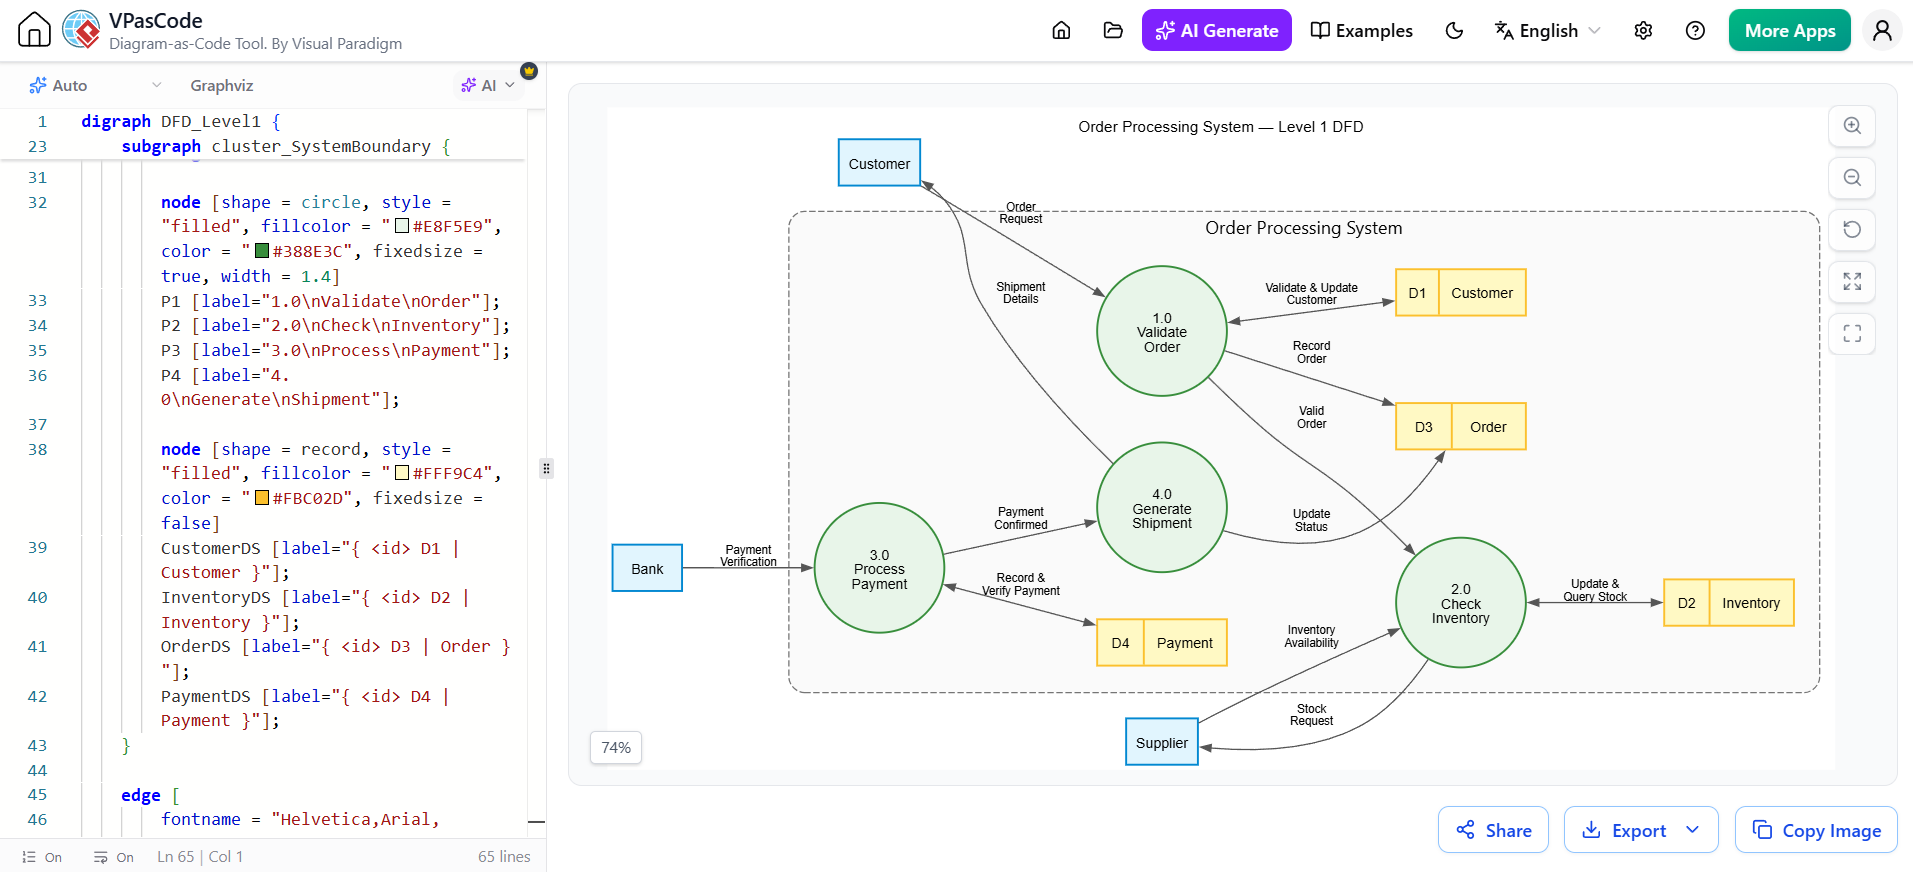
For the Order example, process 0 decomposes into four major functions: Validate Order, Check Inventory, Process Payment, and Generate Shipment. Note that data stores appear here for the first time:
digraph DFD_Level1 {
    graph [
        rankdir = LR
        splines = true
        overlap = false
        nodesep = 0.5
        ranksep = 0.8
        fontname = "Helvetica,Arial,sans-serif"
        fontsize = 12
        label = "Order Processing System — Level 1 DFD"
        labelloc = t
    ]

    node [
        fontname = "Helvetica,Arial,sans-serif"
        fontsize = 11
        penwidth = 1.5
    ]

    node [shape = box, style = "filled", fillcolor = "#E1F5FE", color = "#0288D1"]
    Customer; Supplier; Bank;

    subgraph cluster_SystemBoundary {
        label = "Order Processing System";
        fontname = "Helvetica,Arial,sans-serif; bold"
        fontsize = 14
        color = "#757575"
        style = "dashed,rounded"
        bgcolor = "#FAFAFA"
        margin = 20

        node [shape = circle, style = "filled", fillcolor = "#E8F5E9", color = "#388E3C", fixedsize = true, width = 1.4]
        P1 [label="1.0\nValidate\nOrder"];
        P2 [label="2.0\nCheck\nInventory"];
        P3 [label="3.0\nProcess\nPayment"];
        P4 [label="4.0\nGenerate\nShipment"];

        node [shape = record, style = "filled", fillcolor = "#FFF9C4", color = "#FBC02D", fixedsize = false]
        CustomerDS [label="{ <id> D1 | Customer }"];
        InventoryDS [label="{ <id> D2 | Inventory }"];
        OrderDS [label="{ <id> D3 | Order }"];
        PaymentDS [label="{ <id> D4 | Payment }"];
    }

    edge [
        fontname = "Helvetica,Arial,sans-serif"
        fontsize = 9
        color = "#555555"
        arrowsize = 0.8
    ]

    Customer -> P1 [label="Order\nRequest"];
    Bank -> P3 [label="Payment\nVerification"];
    Supplier -> P2 [label="Inventory\nAvailability"];
    P1 -> P2 [label="Valid\nOrder"];
    P3 -> P4 [label="Payment\nConfirmed"];
    P1 -> CustomerDS [label="Validate & Update\nCustomer", dir=both];
    P2 -> InventoryDS [label="Update &\nQuery Stock", dir=both];
    P1 -> OrderDS [label="Record\nOrder"];
    P3 -> PaymentDS [label="Record &\nVerify Payment", dir=both];
    P4 -> OrderDS [label="Update\nStatus"];
    P2 -> Supplier [label="Stock\nRequest"];
    P4 -> Customer [label="Shipment\nDetails"];
}
Key things happening here that you should always check for:
-
Numbering is consistent (
1.0…4.0) matching the parent0. -
Balancing (described below) — the flows into and out of process
0in the Context Diagram must equal the flows into and out of the Level 1 diagram as a whole. -
Bidirectional store access (e.g.
P1 -> CustomerDS [dir=both]) is drawn as a single, merged edge rather than two clutter arrows.
2.3 Level 2 DFD (and Beyond)
-
Abstraction: Further decomposition of a single Level 1 process.
-
What it shows: Granular detail for complex processes. Each sub-process gets an atomic function.
-
Purpose: You continue creating Level 3, Level 4, etc. until each leaf process is simple enough to describe in a short narrative or pseudocode — that terminal process is called a Functional Primitive (a primitive process).
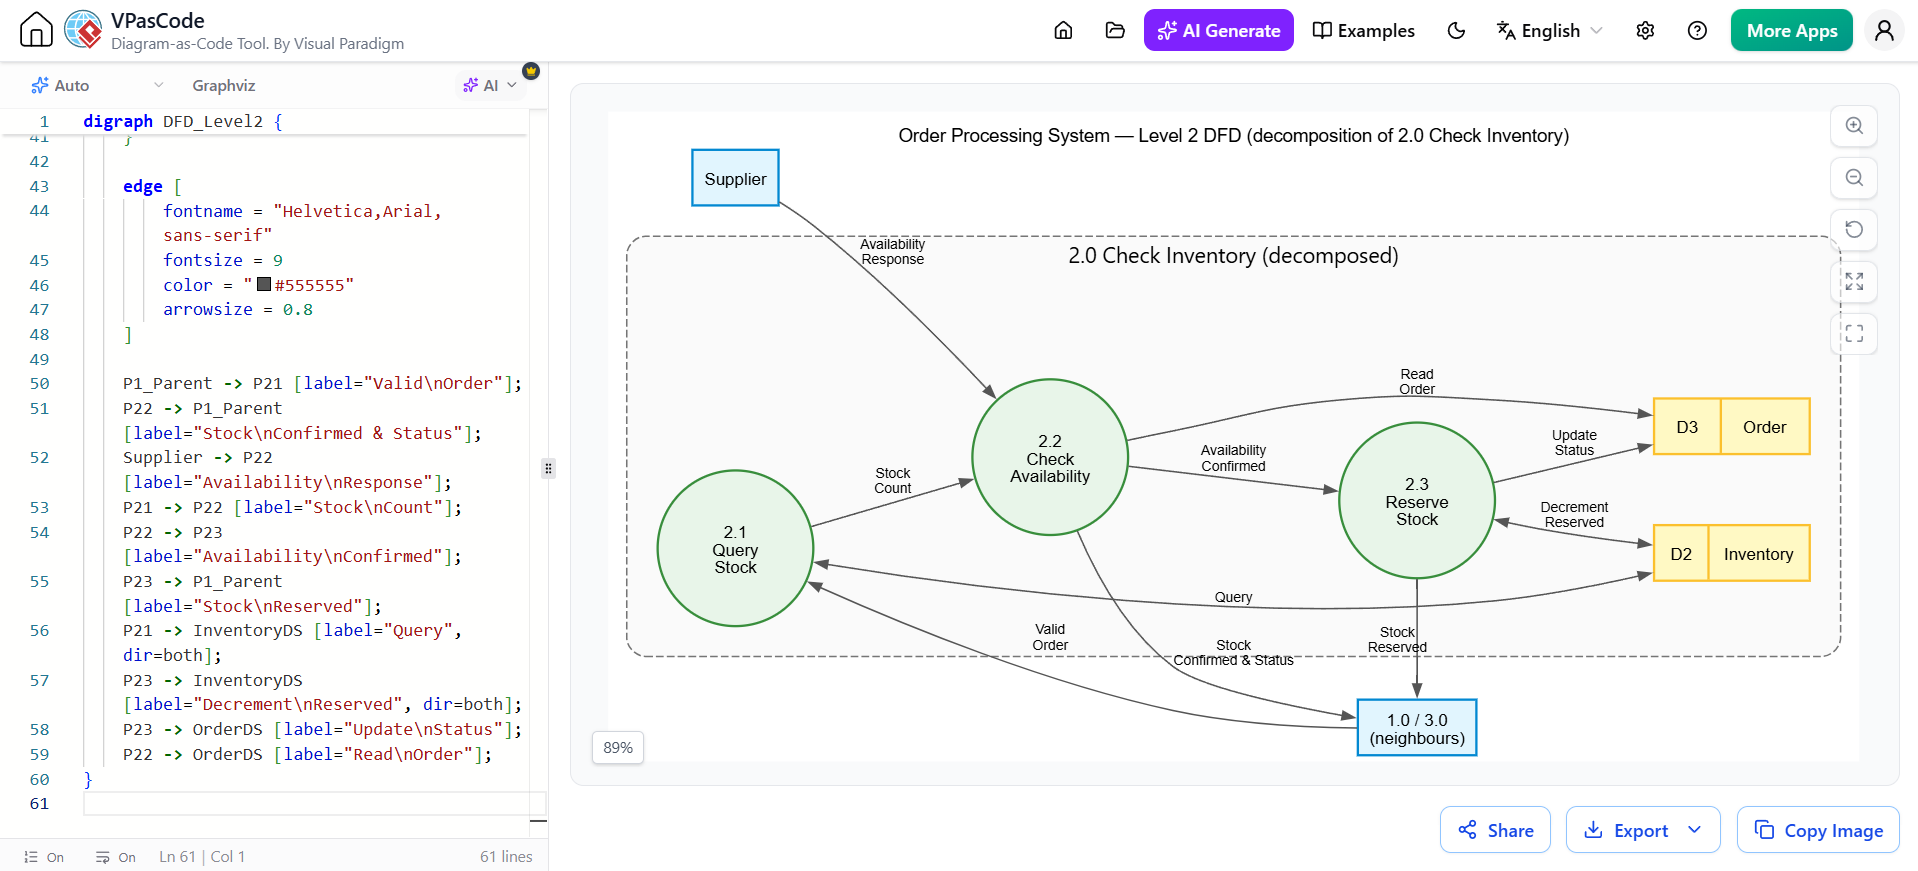
Here we zoom into process 2.0 Check Inventory from the Level 1 DFD, breaking it into 2.1 Query Stock, 2.2 Check Availability, and 2.3 Reserve Stock:
digraph DFD_Level2 {
    graph [
        rankdir = LR
        splines = true
        overlap = false
        nodesep = 0.4
        ranksep = 0.8
        fontname = "Helvetica,Arial,sans-serif"
        fontsize = 12
        label = "Order Processing System — Level 2 DFD (decomposition of 2.0 Check Inventory)"
        labelloc = t
    ]

    node [
        fontname = "Helvetica,Arial,sans-serif"
        fontsize = 11
        penwidth = 1.5
    ]

    node [shape = box, style = "filled", fillcolor = "#E1F5FE", color = "#0288D1"]
    P1_Parent [label="1.0 / 3.0\n(neighbours)"];
    Supplier;

    subgraph cluster_SystemBoundary {
        label = "2.0 Check Inventory (decomposed)";
        fontname = "Helvetica,Arial,sans-serif; bold"
        fontsize = 14
        color = "#757575"
        style = "dashed,rounded"
        bgcolor = "#FAFAFA"
        margin = 20

        node [shape = circle, style = "filled", fillcolor = "#E8F5E9", color = "#388E3C", fixedsize = true, width = 1.4]
        P21 [label="2.1\nQuery\nStock"];
        P22 [label="2.2\nCheck\nAvailability"];
        P23 [label="2.3\nReserve\nStock"];

        node [shape = record, style = "filled", fillcolor = "#FFF9C4", color = "#FBC02D", fixedsize = false]
        InventoryDS [label="{ <id> D2 | Inventory }"];
        OrderDS [label="{ <id> D3 | Order }"];
    }

    edge [
        fontname = "Helvetica,Arial,sans-serif"
        fontsize = 9
        color = "#555555"
        arrowsize = 0.8
    ]

    P1_Parent -> P21 [label="Valid\nOrder"];
    P22 -> P1_Parent [label="Stock\nConfirmed & Status"];
    Supplier -> P22 [label="Availability\nResponse"];
    P21 -> P22 [label="Stock\nCount"];
    P22 -> P23 [label="Availability\nConfirmed"];
    P23 -> P1_Parent [label="Stock\nReserved"];
    P21 -> InventoryDS [label="Query", dir=both];
    P23 -> InventoryDS [label="Decrement\nReserved", dir=both];
    P23 -> OrderDS [label="Update\nStatus"];
    P22 -> OrderDS [label="Read\nOrder"];
}
When do you stop? The rule of thumb: keep decomposing until each leaf process is a Functional Primitive — a process simple enough to be fully specified by a few lines of pseudocode or a short user story. There’s no fixed target level; complexity drives depth. A small process may be primitive at Level 1; a large one may need Level 3 or 4.
3. Logical vs. Physical DFDs — The Intent Dimension
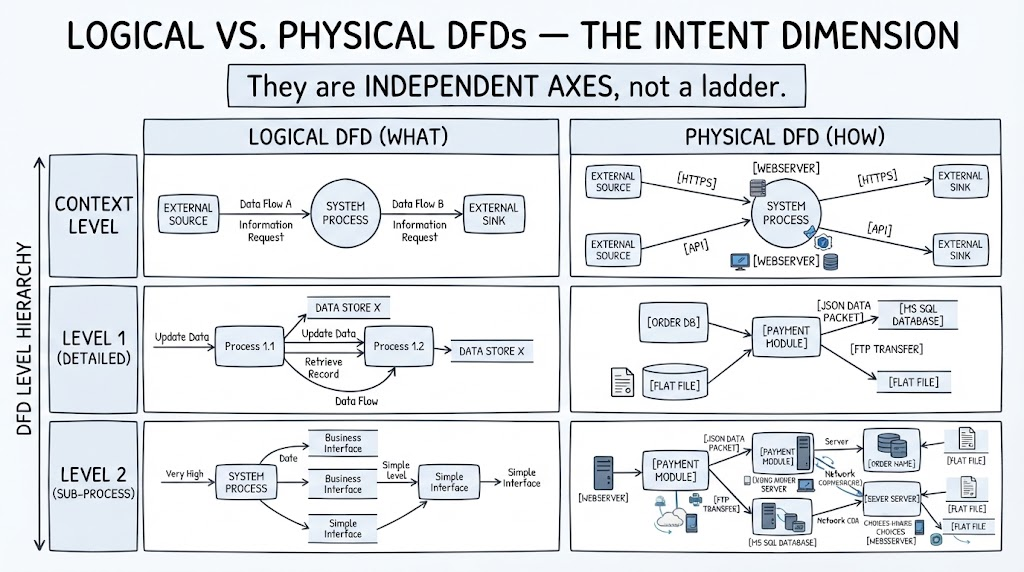
This is the axis you correctly flagged as being conflated with Class Diagram terminology. Let’s be precise:
-
Class Diagrams use Conceptual/Logical/Physical to express levels of abstraction of a data model.
-
DFDs use Logical/Physical to express design intent — what vs. how — and this is orthogonal to the Level hierarchy.
That means every level (Context, Level 1, Level 2) can be drawn as either a Logical DFD or a Physical DFD. They are independent axes, not a ladder.
3.1 Logical DFD — What the System Does
| Aspect | Detail |
|---|---|
| Focus | Business requirements and what the system must accomplish — without implementation bias. |
| Deliberately ignores | Hardware, software, databases, departments, manual-vs-automated, file formats, timing. |
| Used in | Requirements analysis and business modeling. |
Compare this Logical membership DFD with the Physical one directly below it. Same system, same level — but the Logical one names no technologies and no specific departments, only business activities and conceptual data stores:
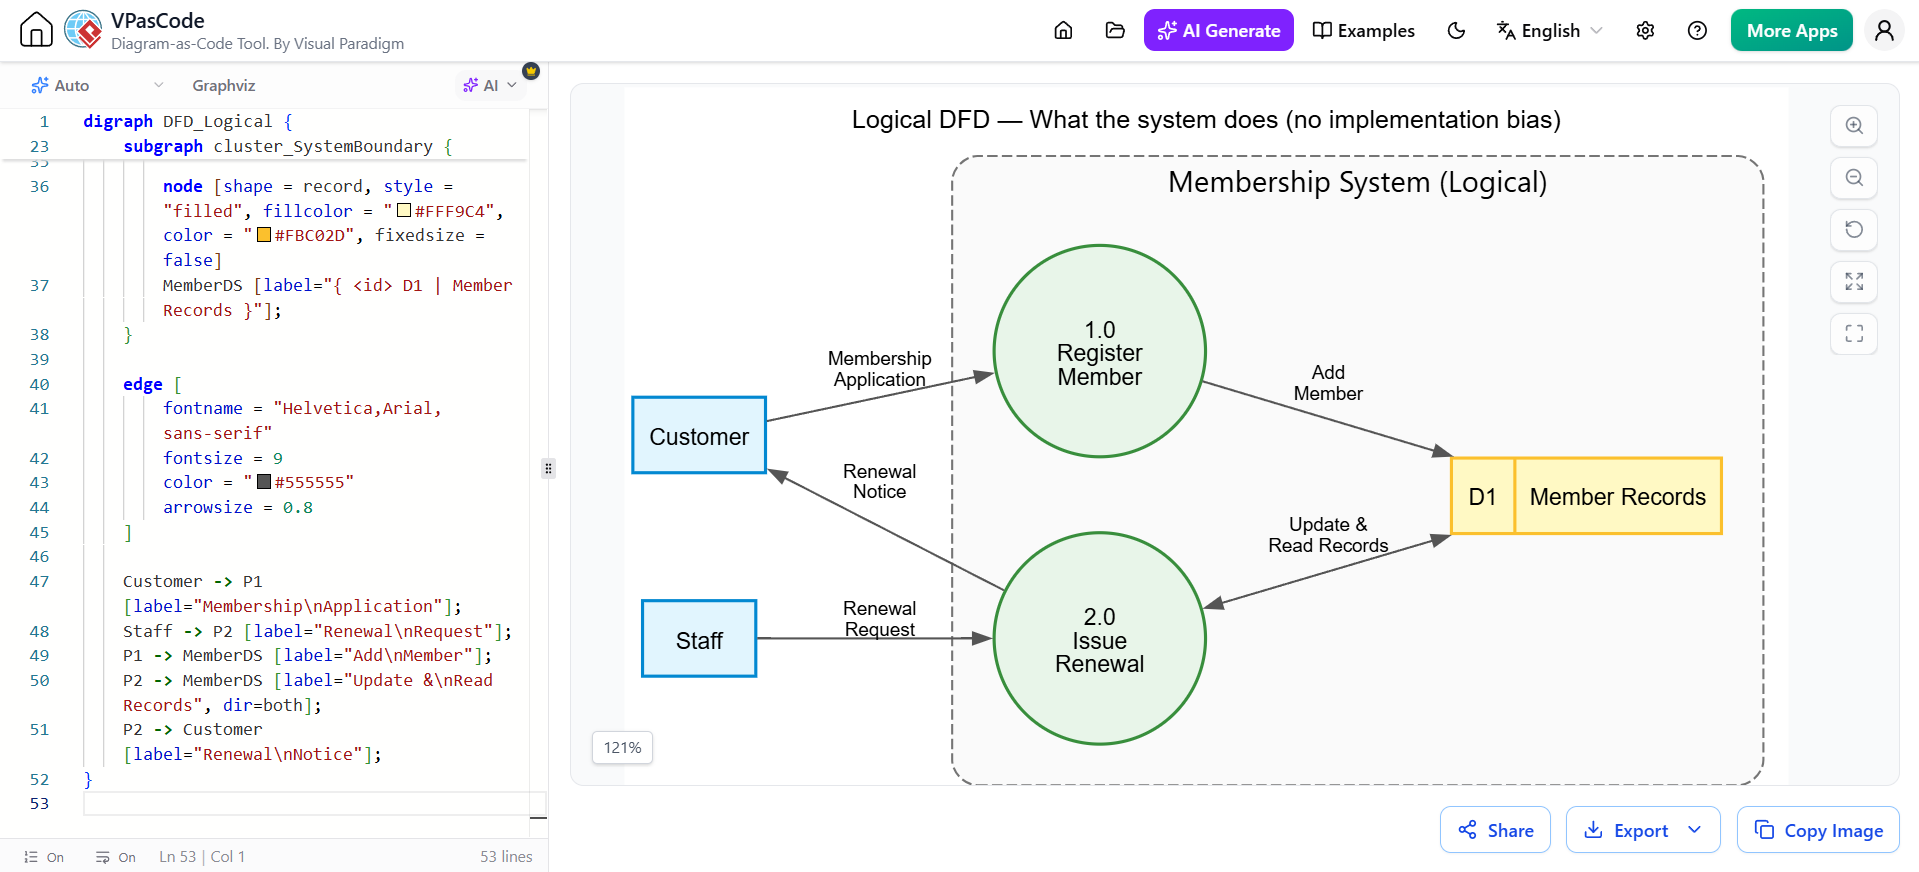
digraph DFD_Logical {
    graph [
        rankdir = LR
        splines = true
        overlap = false
        nodesep = 0.5
        ranksep = 0.8
        fontname = "Helvetica,Arial,sans-serif"
        fontsize = 12
        label = "Logical DFD — What the system does (no implementation bias)"
        labelloc = t
    ]

    node [
        fontname = "Helvetica,Arial,sans-serif"
        fontsize = 11
        penwidth = 1.5
    ]

    node [shape = box, style = "filled", fillcolor = "#E1F5FE", color = "#0288D1"]
    Customer; Staff;

    subgraph cluster_SystemBoundary {
        label = "Membership System (Logical)";
        fontname = "Helvetica,Arial,sans-serif; bold"
        fontsize = 14
        color = "#757575"
        style = "dashed,rounded"
        bgcolor = "#FAFAFA"
        margin = 20

        node [shape = circle, style = "filled", fillcolor = "#E8F5E9", color = "#388E3C", fixedsize = true, width = 1.4]
        P1 [label="1.0\nRegister\nMember"];
        P2 [label="2.0\nIssue\nRenewal"];

        node [shape = record, style = "filled", fillcolor = "#FFF9C4", color = "#FBC02D", fixedsize = false]
        MemberDS [label="{ <id> D1 | Member Records }"];
    }

    edge [
        fontname = "Helvetica,Arial,sans-serif"
        fontsize = 9
        color = "#555555"
        arrowsize = 0.8
    ]

    Customer -> P1 [label="Membership\nApplication"];
    Staff -> P2 [label="Renewal\nRequest"];
    P1 -> MemberDS [label="Add\nMember"];
    P2 -> MemberDS [label="Update &\nRead Records", dir=both];
    P2 -> Customer [label="Renewal\nNotice"];
}
3.2 Physical DFD — How the System is Implemented
| Aspect | Detail |
|---|---|
| Focus | The concrete realization of the logical model: specific technologies, file / DB names, people, departments, hardware, timing, protocols. |
| Includes | DBMS and schema names, message queues, APIs & protocols (HTTPS, JSON, JDBC, JMS), people and departments, automation choices. |
| Used in | System design and implementation planning. |
The same membership system, now as a Physical DFD — note process 1.0 becomes a Register Service (Server), the data store becomes MySQL members_db, an Email Queue appears, and flows are labeled with concrete protocols:
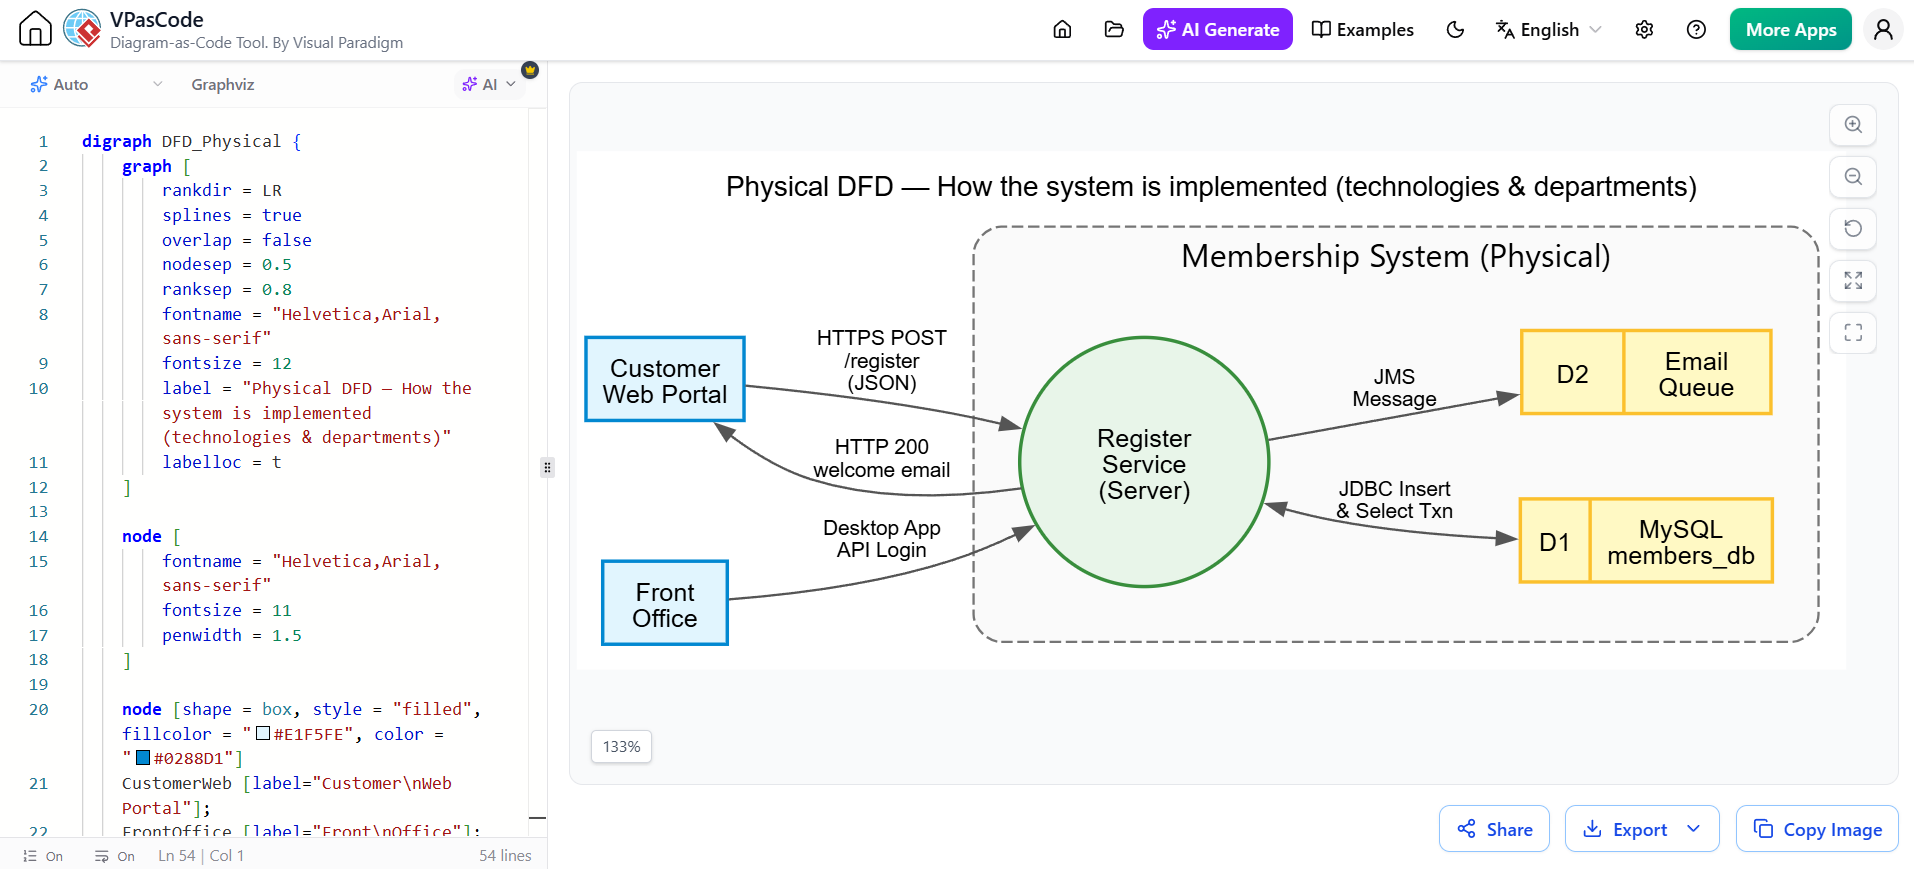
digraph DFD_Physical {
    graph [
        rankdir = LR
        splines = true
        overlap = false
        nodesep = 0.5
        ranksep = 0.8
        fontname = "Helvetica,Arial,sans-serif"
        fontsize = 12
        label = "Physical DFD — How the system is implemented (technologies & departments)"
        labelloc = t
    ]

    node [
        fontname = "Helvetica,Arial,sans-serif"
        fontsize = 11
        penwidth = 1.5
    ]

    node [shape = box, style = "filled", fillcolor = "#E1F5FE", color = "#0288D1"]
    CustomerWeb [label="Customer\nWeb Portal"];
    FrontOffice [label="Front\nOffice"];

    subgraph cluster_SystemBoundary {
        label = "Membership System (Physical)";
        fontname = "Helvetica,Arial,sans-serif; bold"
        fontsize = 14
        color = "#757575"
        style = "dashed,rounded"
        bgcolor = "#FAFAFA"
        margin = 20

        node [shape = circle, style = "filled", fillcolor = "#E8F5E9", color = "#388E3C", fixedsize = true, width = 1.5]
        SRV [label="Register\nService\n(Server)"];

        node [shape = record, style = "filled", fillcolor = "#FFF9C4", color = "#FBC02D", fixedsize = false]
        MySQLDS [label="{ <id> D1 | MySQL\nmembers_db }"];
        QueueDS [label="{ <id> D2 | Email\nQueue }"];
    }

    edge [
        fontname = "Helvetica,Arial,sans-serif"
        fontsize = 9
        color = "#555555"
        arrowsize = 0.8
    ]

    CustomerWeb -> SRV [label="HTTPS POST\n/register\n(JSON)"];
    FrontOffice -> SRV [label="Desktop App\nAPI Login"];
    SRV -> MySQLDS [label="JDBC Insert\n& Select Txn", dir=both];
    SRV -> QueueDS [label="JMS\nMessage"];
    SRV -> CustomerWeb [label="HTTP 200\nwelcome email"];
}
Takeaway: A mature project produces Logical DFDs first (Context through Level 2) during requirements gathering so stakeholders can verify correctness of behavior without technical noise, then derives Physical DFDs from them during design — when the “what” is agreed, the “how” can be layered on. The levels stay parallel: your Physical Level 1 mirrors your Logical Level 1, enriched with implementation detail.
4. Mapping DFD Levels to Class Diagram Abstraction
If you already think in terms of Class Diagram abstraction, here’s an approximate (and useful but imperfect) bridge:
| Class Diagram Notion | ≈ DFD Equivalent |
|---|---|
| Conceptual Class Diagram (business-level understanding) | Context Diagram or Level 1 Logical DFD |
| Logical Class Diagram (detailed functional specification) | Level 2+ Logical DFD |
| Physical / Implementation Class Diagram (technology-specific design) | Physical DFD |
Caveat: This mapping is a mental-model convenience, not formal equivalence. As you noted, the authoritative terminology in systems analysis literature (DeMarco, Gane & Sarson, Yourdon) is strictly Context, Level 1, Level 2… together with the orthogonal Logical/Physical distinction.
5. The Critical Quality Rules of DFDs
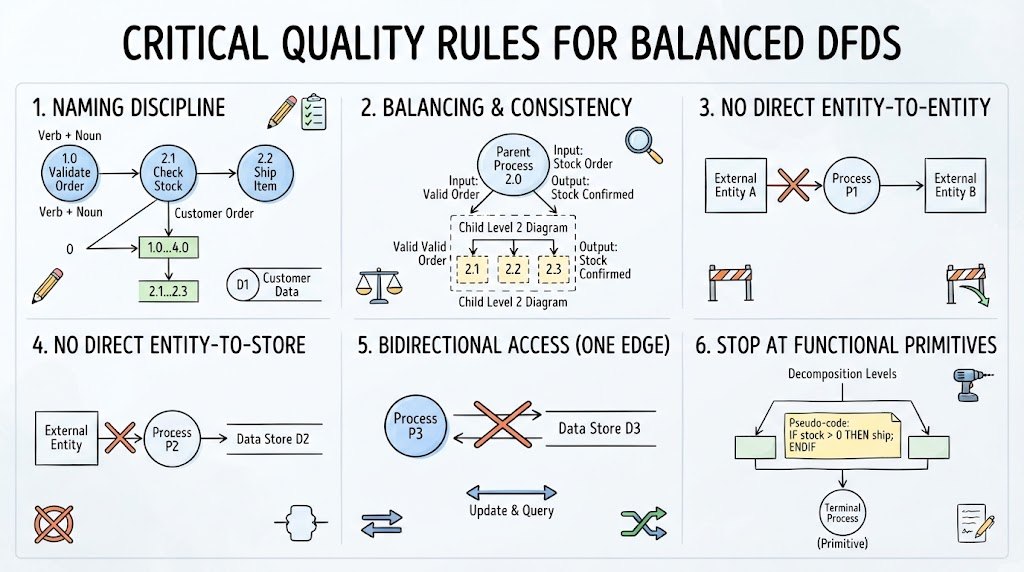
These are the invariants that separate a professional, balanced DFD from a sloppy one:
-
Naming discipline. Every process has a verb + a noun, is numbered, and the numbering forms a strict tree (
0→1.0…4.0→2.1…2.3). Every data store is numberedD1,D2, … Every flow has a descriptive label. -
Balancing (consistency across levels). The inputs and outputs of a parent process must exactly match the combined inputs and outputs of its child processes. If process
2.0receivesValid Orderand returnsStock Confirmed, then the Level 2 diagram decomposing2.0must acceptValid Orderand must produceStock Confirmed— no more, no less. This is the single most important rule when decomposing. -
No direct entity-to-entity flows. Data always flows through a process. External entities never connect straight to each other or to data stores.
-
No direct entity-to-store flows. External entities interact with stores only via a process (in a DeMarco/Yourdon convention this is a strict rule).
-
Bidirectional access is one edge. When two elements exchange data both ways (typical with data stores), draw a single arrow with
dir=bothand a merged label ("Update & Query"), not two separate one-way arrows — that keeps the diagram uncluttered and legible. -
Stop at functional primitives. Decompose only as deep as needed; the terminal processes should be describable in a few lines of pseudocode.
6. Visual Conventions Used in These Diagrams
All the examples above follow the standard modern DFD styling that renders cleanly in Graphviz:
-
External entities — light blue boxes with blue borders (
#E1F5FE/#0288D1). -
Processes — green circles with green borders (
#E8F5E9/#388E3C), numbered and verb-named. -
Data stores — record-style yellow bars (
#FFF9C4/#FBC02D) labeled with ID + name (D2 | Inventory). -
System boundary — a dashed, rounded container (cluster) with a light background (
#FAFAFA) and gray border (#757575). -
Edges — mid-gray (
#555555), small arrowheads, axis-aligned routing via thedotengine.
7. Checklist Before You Present a DFD
Use this as a self-review gate before treating any DFD as done:
-
Is the level clearly stated (Context / Level n)? Is the numbering tree consistent with the parent?
-
Are all four symbol types used correctly, with the right naming patterns?
-
Is the diagram balanced against its parent (flows in/out match exactly)?
-
Are all flows labeled with meaningful data descriptors?
-
Are bidirectional store/vendor flows merged into single
dir=bothedges? -
Are boundary and external entities free of direct entity↔entity / entity↔store flows?
-
Does each leaf process qualify as a functional primitive?
8. Summary
-
Hierarchy = Levels. Context (Level 0) → Level 1 → Level 2 → … Each level decomposes one process into finer sub-processes until functional primitives are reached.
-
Intent = Logical vs Physical. Logical DFDs answer what; Physical DFDs answer how. The two axes are orthogonal — each level can be drawn either way.
-
Don’t call DFD levels “conceptual/logical/physical.” Those are class-model terms. In formal systems analysis (DeMarco, Gane & Sarson, Yourdon), the correct vocabulary is Context / Level 1 / Level 2 plus the Logical/Physical distinction.
-
Best practice: build Logical DFDs through Level 0–2 during analysis to lock down requirements, then derive Physical DFDs during design to plan the implementation.
The four Graphviz diagrams above (Context, Level 1, Level 2, and the Logical/Physical pair) demonstrate the full progression. Each renders directly from the code blocks — you can copy any of them into Graphviz to see the rendered result.
Conclusion
References
- Mastering Data Flow Diagrams: From Manual Drawing to AI-Assisted Modeling with Visual Paradigm: A comprehensive guide covering DFD basics, manual creation steps, and the innovative AI-assisted modeling workflow using the VP AI Chatbot .
- Mastering Data Flow Diagrams: A Comprehensive Guide to AI-Assisted Top-Down Decomposition with Visual Paradigm: This blog post dives deep into using Visual Paradigm’s AI for top-down decomposition, demonstrating how to generate Level 1, 2, and 3 DFDs conversationally .
- Mastering Data Flow Diagrams with Visual Paradigm: A Step-by-Step Guide: An official guide that provides a practical, step-by-step tutorial on creating DFDs, starting with templates and using real-world examples like an online shopping system .
- How to Create DFD with Visual Paradigm Desktop: A practical walkthrough focused on the desktop version, explaining how to create a project, draw context and level-1 diagrams, and use the decomposition feature .
- Mastering Data Flow Diagram Levels and Balancing: A resource that addresses the critical concept of balancing data flow diagrams across different levels to ensure consistency and accuracy in system analysis .
- Beginner’s Guide to Data Flow Diagrams (DFD) with Visual Paradigm Online: A beginner-friendly guide that introduces DFD concepts and provides a simple, step-by-step tutorial for creating diagrams using the online version of Visual Paradigm .
- Data Flow Diagram Examples: A valuable resource page offering a collection of DFD examples for various systems like a food order system, supermarket app, and inventory management, usable as reference models .