


Introduction
Every system analyst and software designer knows the pain: translating vague, fragmented client requirements into a clear, executable technical specification. You might produce endless flowcharts and pages of documentation, only to have developers respond with confusion about where functions begin, end, or how data relates to specific modules. This communication gap is the primary cause of project delays and rework.
The solution is not more documentation, but better structured visualization. Hierarchical Data Flow Diagrams (DFDs) serve as the definitive “scalpel” for dissecting complex systems. Unlike generic flowcharts, DFDs focus strictly on data transformation and movement, using a top-down decomposition strategy that manages cognitive load effectively.
This comprehensive guide moves beyond theory to provide a battle-tested framework for mastering hierarchical DFDs. Whether you are a product manager, system analyst, or developer, this guide will equip you with the methodology to turn chaotic requirements into precise, actionable blueprints.
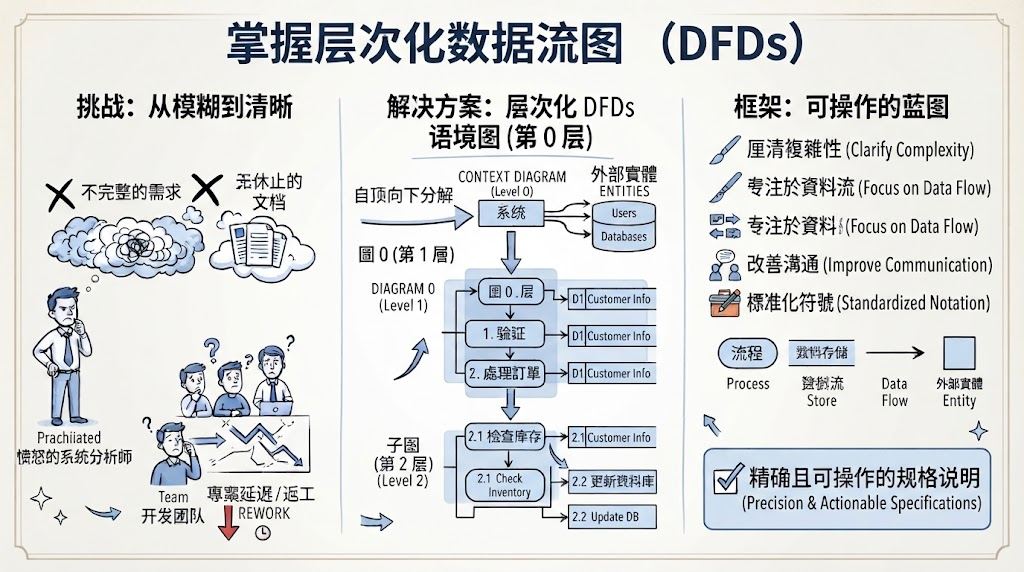
Note on Visual Assets: As this text-based guide reconstructs the original content, please refer to your original source material for the specific diagrams referenced in Sections 3 and 4. The textual descriptions below are designed to align perfectly with those visual examples.
Key Concepts at a Glance
Before diving into the drawing process, internalize these foundational concepts:
| Concept | Definition | Why It Matters |
|---|---|---|
| Decomposition | Breaking a complex system into manageable, nested layers. | Prevents cognitive overload; enables parallel team analysis. |
| Abstraction | Hiding lower-level implementation details behind higher-level interfaces. | Allows stakeholders to focus on relevant levels of detail. |
| Balance Principle | Ensuring input/output data flows match exactly between parent and child diagrams. | Guarantees logical consistency and prevents “data leakage.” |
| 7±2 Rule | Limiting processes per diagram to between 5 and 9 elements. | Aligns with human short-term memory capacity for readability. |
| Functional Cohesion | Grouping sub-processes that operate on the same core data object. | Creates maintainable, loosely coupled system modules. |
1. The Philosophy of Layering: Why Not One Giant Map?
Attempting to capture an entire enterprise system in a single diagram is an engineering anti-pattern. Hierarchical DFDs exist because of two fundamental constraints: human cognition and software maintainability.
The Cognitive Limit
Research in cognitive psychology establishes that humans can effectively process only 5 to 9 information chunks simultaneously. A monolithic diagram with hundreds of nodes violates this limit, rendering it useless for communication. Layering respects this boundary by presenting one coherent level of abstraction at a time.
Engineering Benefits
-
Complexity Control: Readers digest simple, focused diagrams rather than overwhelming maps.
-
Parallel Workstreams: Different teams can own different layers or modules without constant merge conflicts.
-
Change Isolation: Modifications typically affect only a specific layer and its immediate children, making impact analysis predictable.
-
Agile Alignment: Top-down refinement mirrors iterative development, allowing high-level design to stabilize while details evolve.
The Four Pillars of DFD Notation
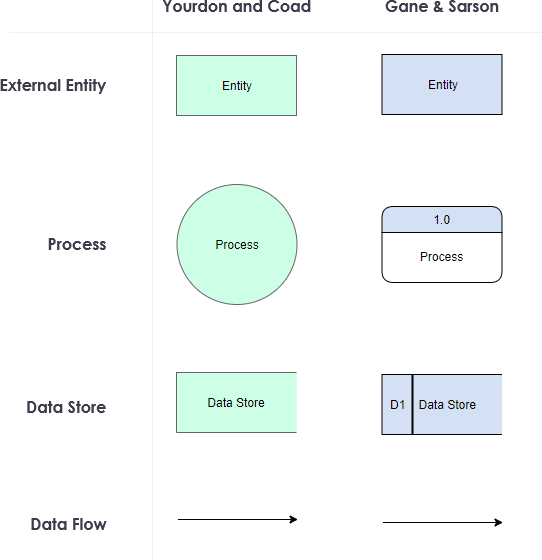
Think of these as your LEGO bricks. Misunderstanding them guarantees flawed models.
-
External Entity (Square/Rectangle): Sources or destinations of data outside the system boundary (e.g., Customer, Payment Gateway). Rule: You cannot change their behavior; you can only define interfaces with them.
-
Process (Rounded Rectangle/Circle): Transformations of data. Every process must have both input and output. Rule: Processes change data state through calculation, validation, filtering, or aggregation.
-
Data Store (Open-ended Rectangle/Parallel Lines): Static repositories (databases, files, caches). Rule: Represents data persistence over time. Processes read from and write to stores.
-
Data Flow (Arrowed Line): The movement of data packets between entities, processes, and stores. Rule: Must be labeled with a noun phrase (e.g., “Order Details,” not “Submit Order”). Flows represent data, never physical objects or pure control signals.
2. Step-by-Step Drawing Methodology
Creating a hierarchical DFD is a disciplined, sequential process. Each step has specific validation criteria.
Step 1: The Context Diagram (Top Level)
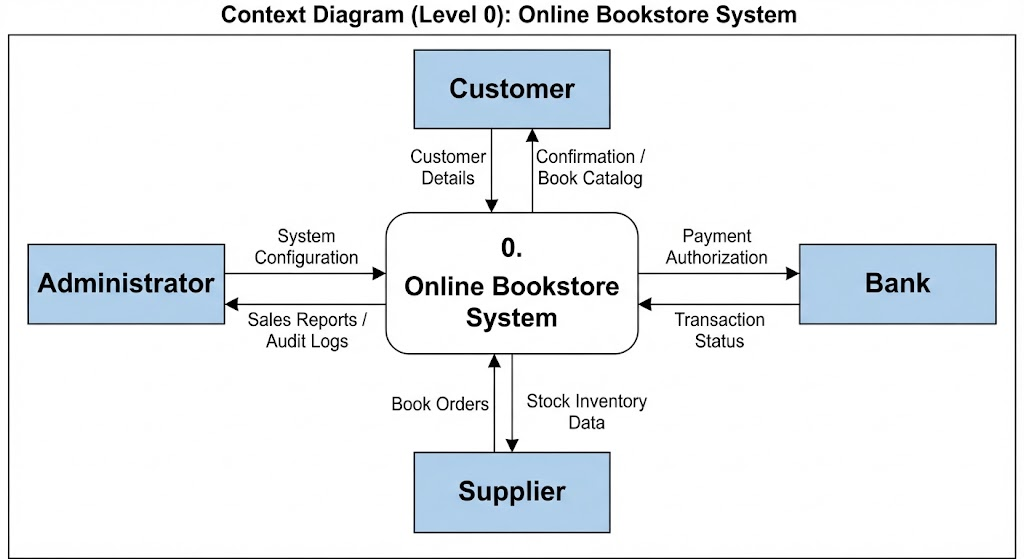
Goal: Define the system boundary and external interfaces. This is your system’s “constitution.”
-
Draw a single central process representing the entire system.
-
Identify all external entities interacting with the system.
-
Connect entities to the central process with labeled data flows.
-
Critical Constraint: No data flows directly between external entities. All interaction must pass through the system. No data stores appear at this level.
[Insert Original Image: Context Diagram Example – Online Bookstore System]
Practical Tip: Use noun phrases for data flows. “Payment Information” is correct; “Process Payment” is incorrect. Ensure external entity names remain consistent across all subsequent layers.
Step 2: The Level-0 Diagram (System Overview)
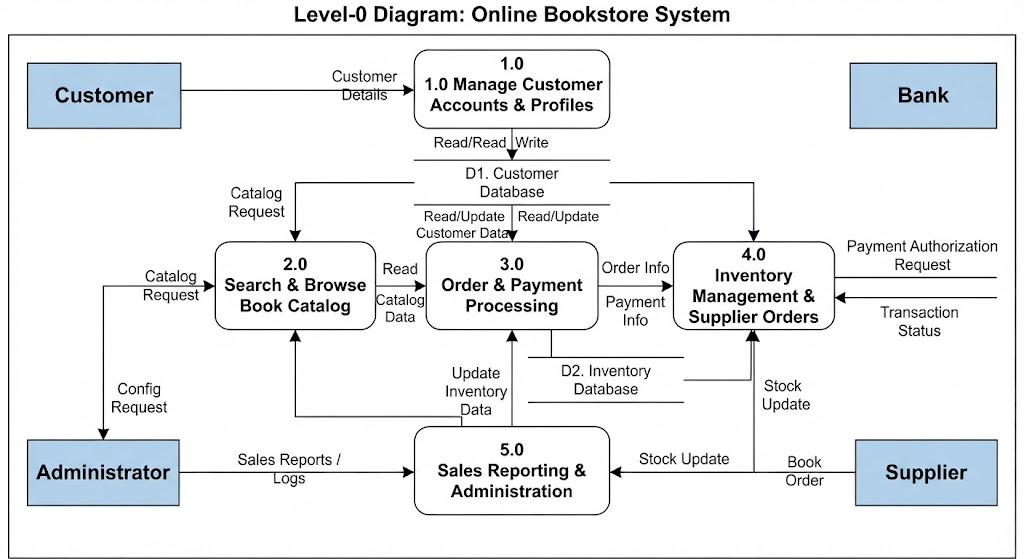
Goal: Explode the central process into major functional subsystems.
-
Decompose the central process into 3–7 major sub-processes representing core business capabilities.
-
Retain all external entities from the Context Diagram.
-
Balance Check: Every input/output flow from the Context Diagram must map exactly to a sub-process in Level-0. No data may appear or disappear.
-
Introduce internal data stores that serve multiple processes.
[Insert Original Image: Level-0 Diagram Example – Online Bookstore System]
Validation: Perform a line-by-line audit. If the Context Diagram shows “Customer → System: Order Info,” then Level-0 must show “Customer → Process 3.0: Order Info.” Missing or extra flows indicate decomposition errors.
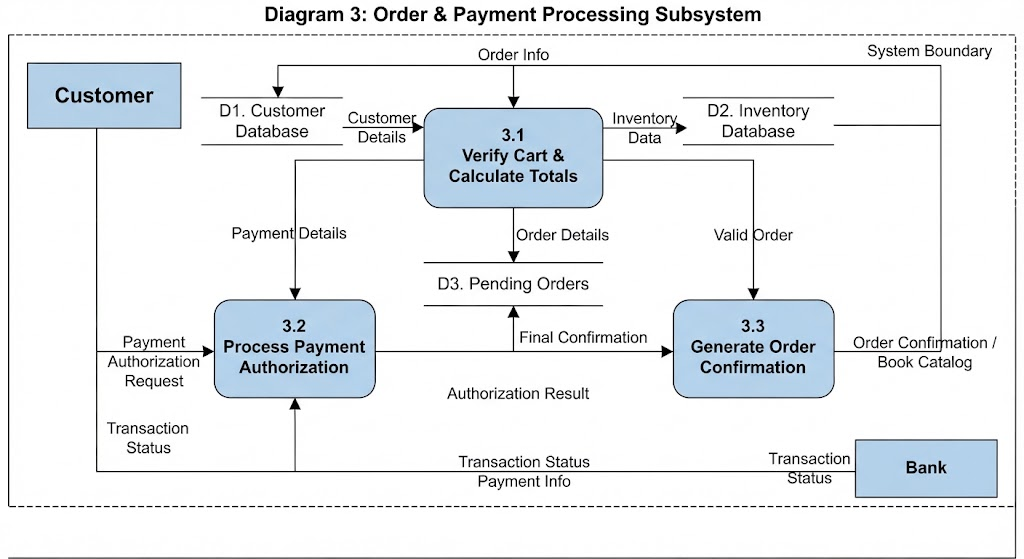
Step 3: Lower-Level Diagrams (Progressive Refinement)
Goal: Decompose complex Level-0 processes until each reaches “functional primitive” status—simple enough to describe in pseudocode or a decision table.
-
Number child diagrams after their parent process (e.g., Process 3.0 expands into Diagram 3).
-
Inherit all parent inputs/outputs exactly.
-
Add internal data flows and local data stores as needed.
-
Stop decomposing when a process can be implemented as a single function/method.
Common Anti-Patterns to Avoid
| Anti-Pattern | Description | Correction |
|---|---|---|
| Black Hole | Process has inputs but no outputs. | Identify missing output: error message, log entry, or status update. |
| Miracle | Process has outputs but no inputs. | Trace data origin: missing input flow or unread data store. |
| Gray Hole | Inputs are insufficient to produce stated outputs. | Add missing input data flows or data store reads. |
| Store-to-Store Flow | Direct arrow between two data stores. | Insert a process between stores; data movement requires transformation. |
| Entity-to-Entity Flow | Direct arrow between external entities. | Remove from DFD; this occurs outside system scope. |
3. Integrated Case Study: Library Borrowing System
To synthesize all concepts, we walk through a complete library system example. (Refer to original images for visual representations of each layer described below.)
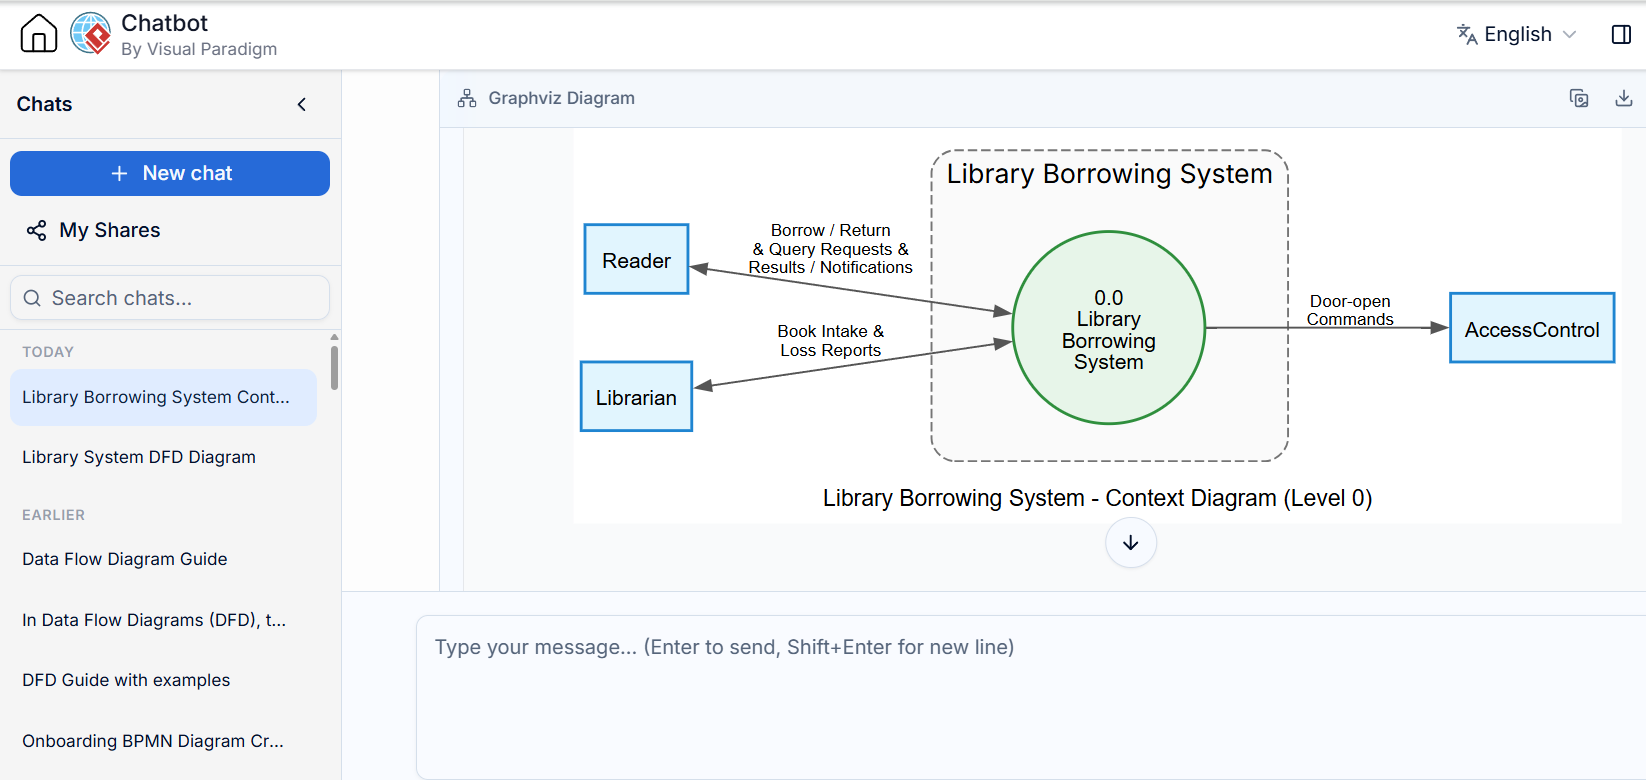
Context Diagram: Boundary Definition
System: Library Borrowing System
-
External Entities: Reader, Librarian, Access Control System (external hardware)
-
Key Flows: Reader submits borrow/return/query requests; System returns results and notifications; Librarian provides book intake and loss reports; System sends door-open commands to Access Control upon successful borrowing.
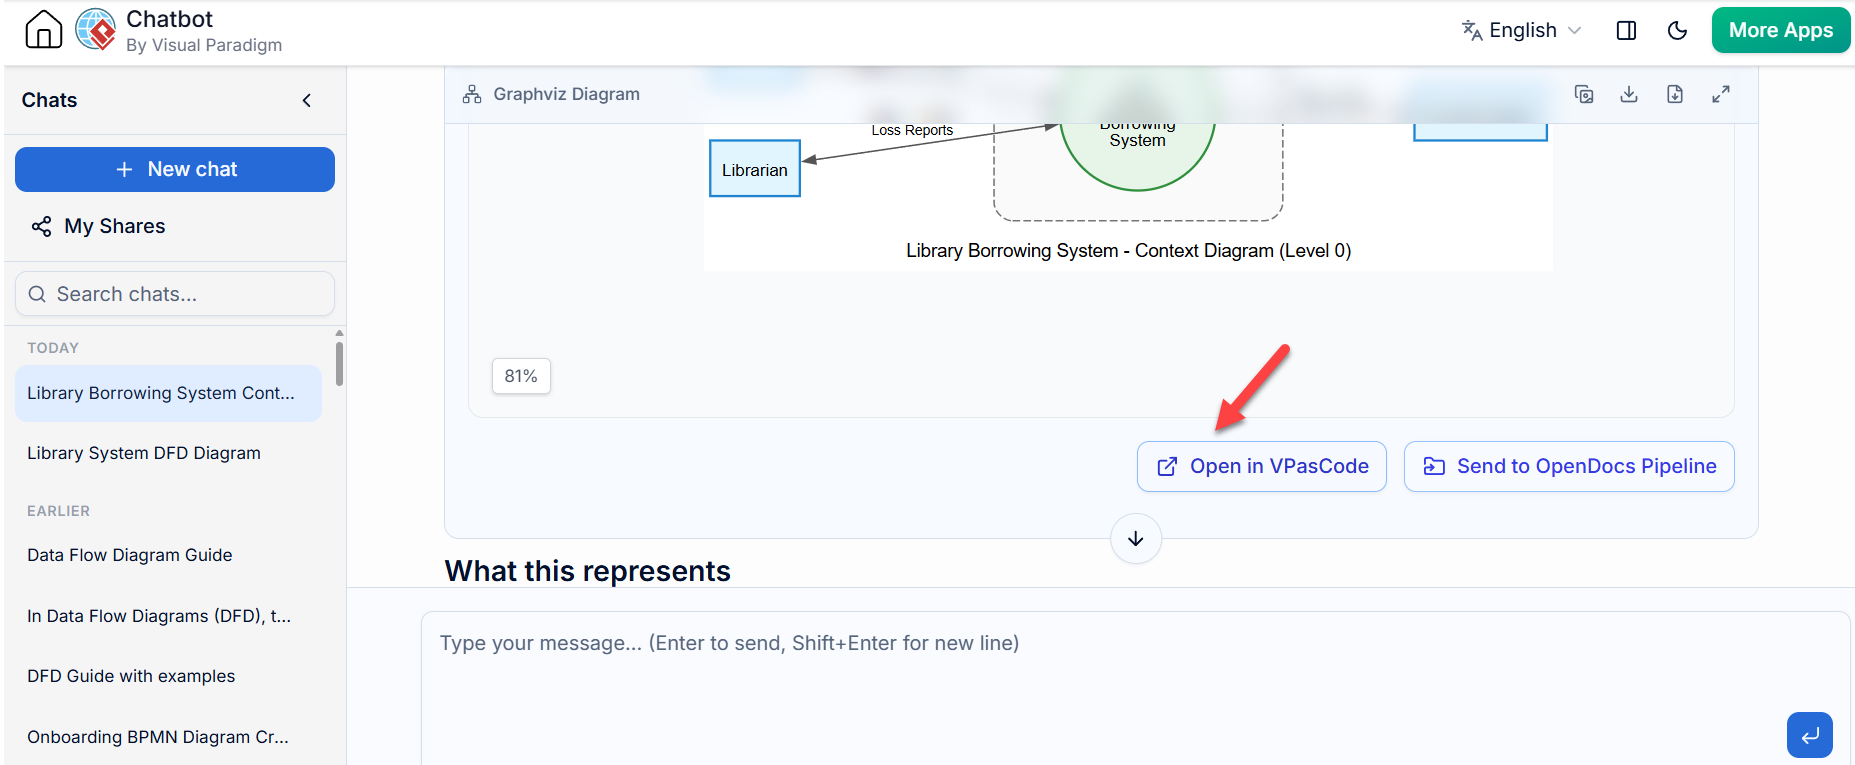
Open in VPasCode
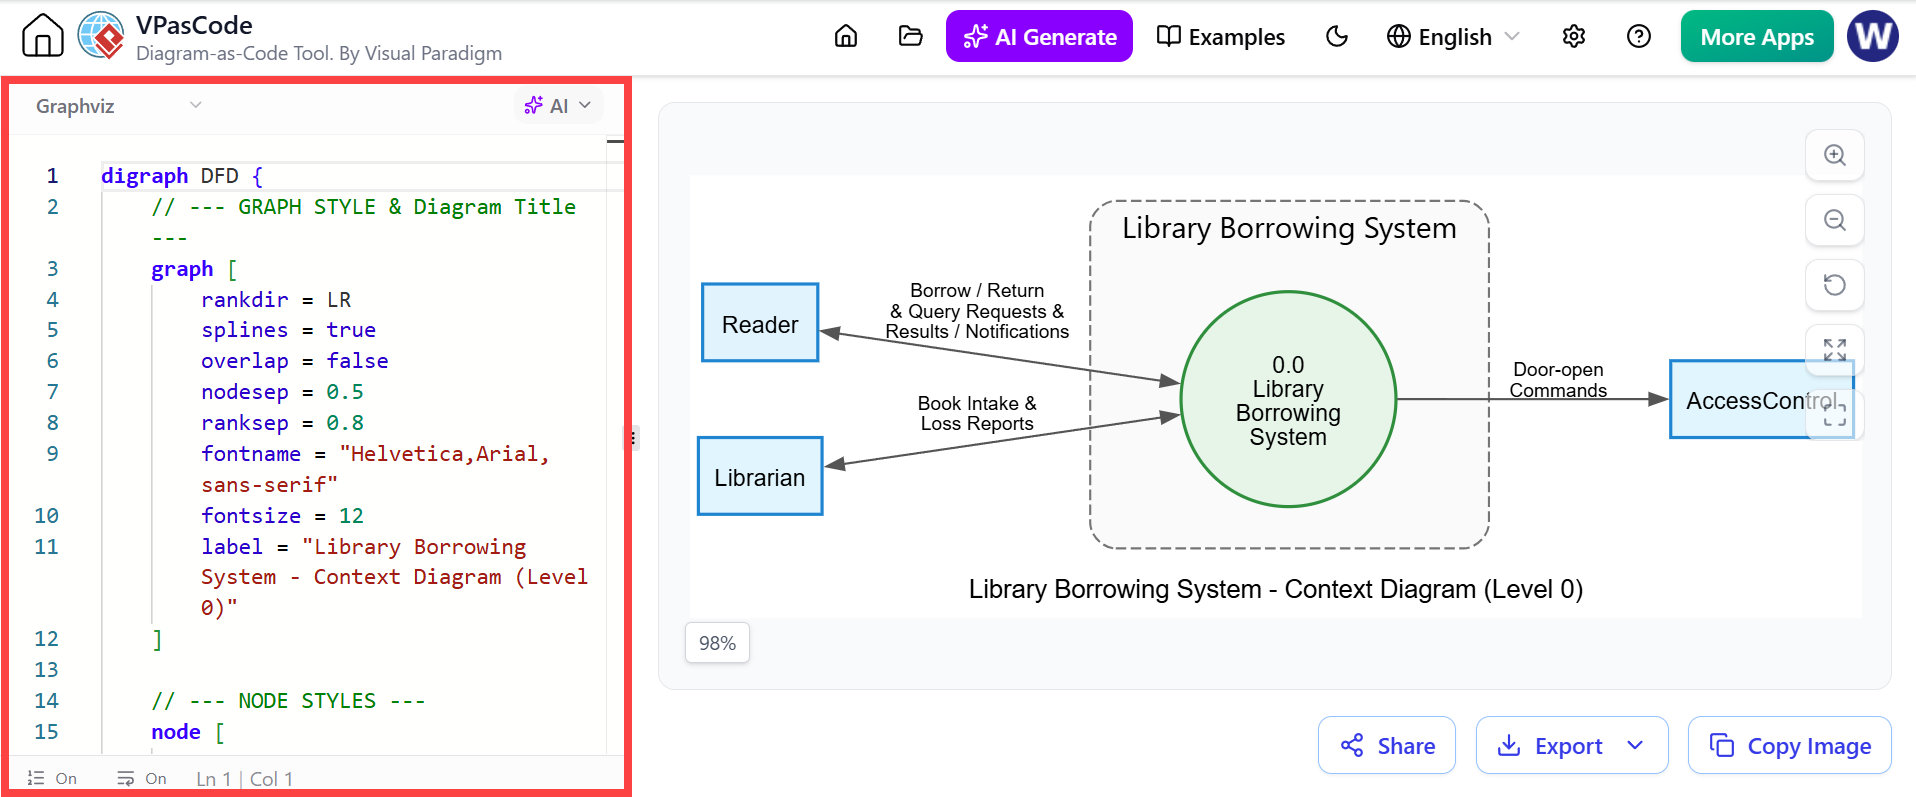
You can now modify it in VPasCode Editor by editing the Graphviz Dot Code
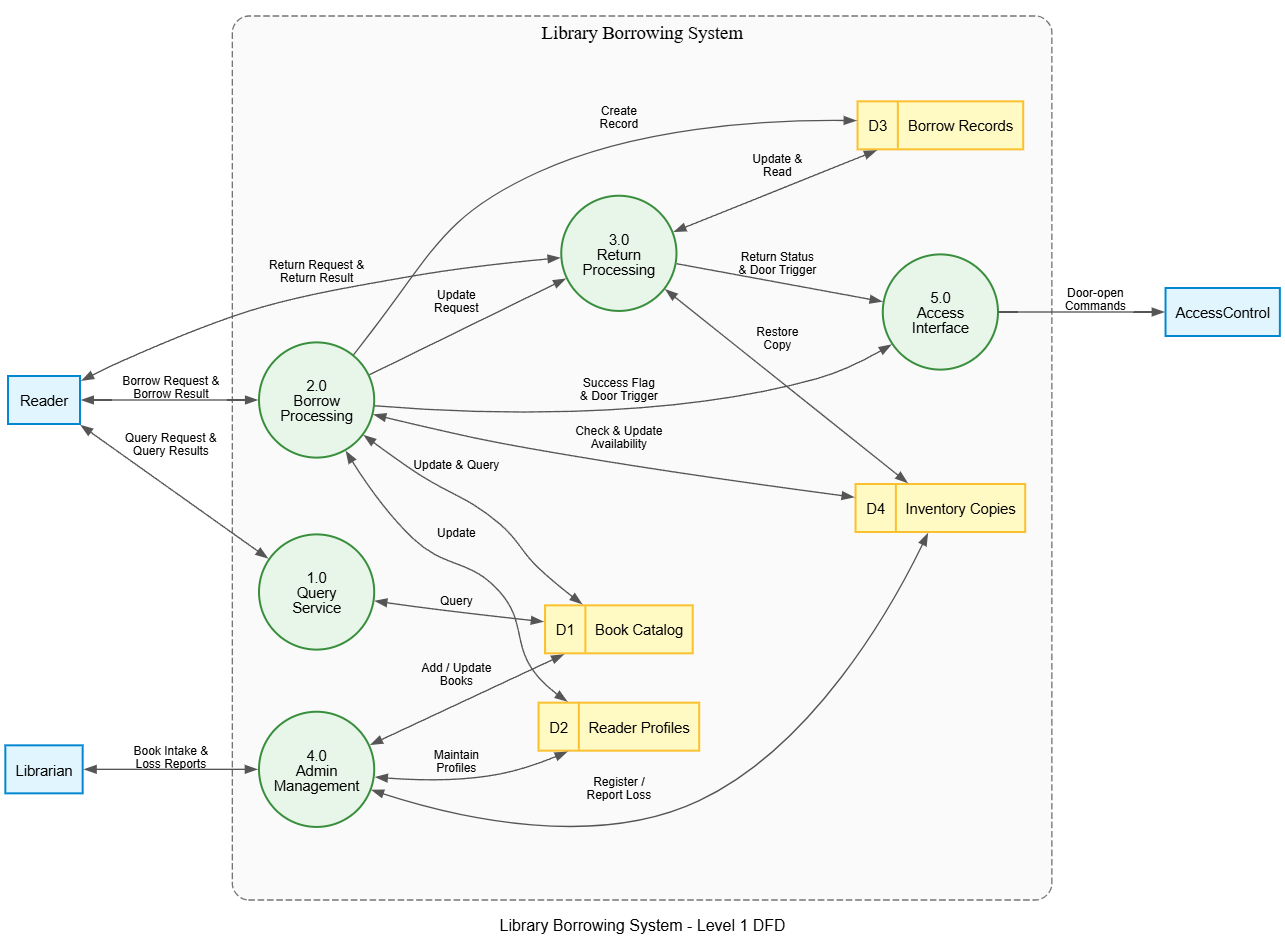
Level-0: Functional Decomposition
-
Processes: 1.0 Query Service, 2.0 Borrow Processing, 3.0 Return Processing, 4.0 Admin Management, 5.0 Access Interface
-
Data Stores: D1 Book Catalog, D2 Reader Profiles, D3 Borrow Records, D4 Inventory Copies
-
Balance Verification: “Borrow Request” from Reader maps to Process 2.0; “Door Open Command” to Access Control maps from Process 5.0; all Context-level flows are accounted for.
Level-1: Refining “2.0 Borrow Processing”
-
2.1 Validate Request: Reads D2; outputs valid request or failure result.
-
2.2 Check Availability: Reads D4; outputs available copy info or unavailability result.
-
2.3 Execute Transaction: Writes D3 (new record), updates D4 (copy status), updates D2 (borrow count).
-
2.4 Generate Response: Produces “Borrow Result” to Reader and “Success Signal” to Process 5.0.
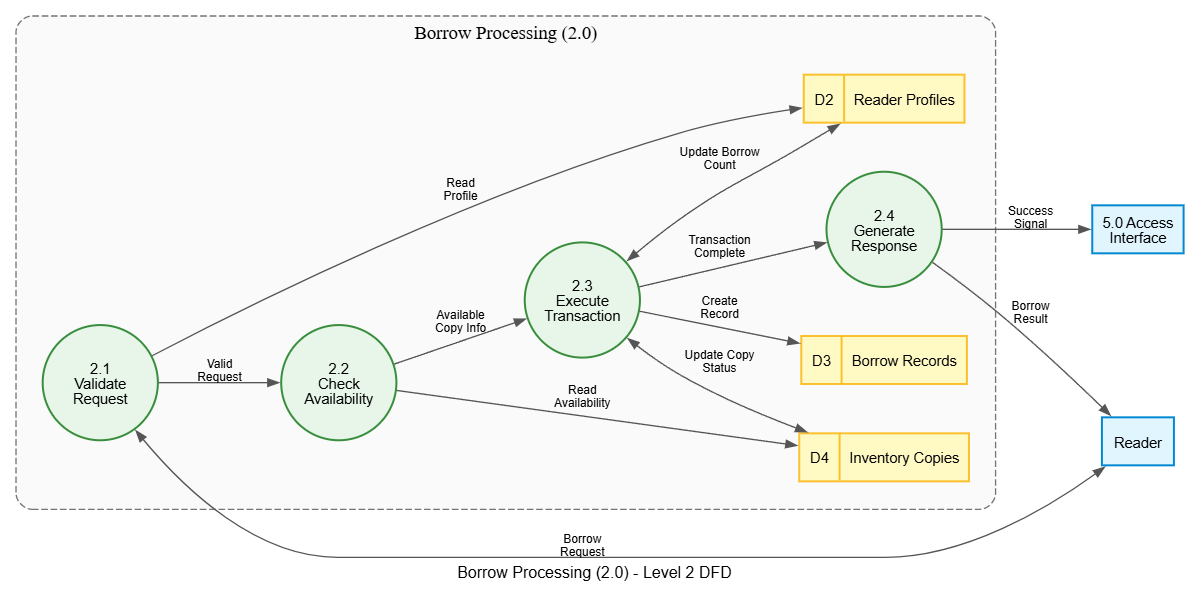
This layered approach transforms an ambiguous “borrow books” requirement into a precise specification showing exact data tables touched, validation rules applied, and transaction boundaries—all before a single line of code is written.
4. Advanced Techniques and Quality Assurance
Consistency Checklist
After completing each layer, validate against:
-
Parent-Child Balance: All external flows preserved exactly.
-
Data Conservation: No black holes, miracles, or gray holes.
-
Store Usage: Every data store has both read and write connections (or documented initialization/consumption rationale).
-
Naming Consistency: Identical data flows use identical names across all diagrams. Maintain a formal data dictionary.
-
Depth Uniformity: Asymmetric decomposition is acceptable; stop when clarity is achieved, not when all branches reach equal depth.
Handling Control Logic
DFDs model data, not control. To represent conditional logic:
-
Encapsulate decisions within processes. Multiple output flows from one process represent different outcomes (e.g., “Validated Request” vs. “Rejection Notice”).
-
Never label data flows with “Yes/No.” Use descriptive nouns: “Approved Order” vs. “Rejected Order.”
-
Concurrent outputs are valid and represent parallel data generation.
Tooling and Best Practices
-
Recommended Tools: Visual Paradigm Online (free, collaborative, rich symbol library); PlantUML/vpAsCode (version-controlled, text-as-diagram for engineering teams).
-
Workflow: Always sketch on paper/whiteboard first to validate logic before digital rendering.
-
Simplicity Test: If a diagram feels crowded, decompose further. Respect the 7±2 rule.
-
Legend: Include a symbol legend on every diagram for unfamiliar readers.
-
Data Dictionary: Maintain a separate document defining every data flow and store’s structure. This eliminates ambiguity and feeds directly into database design.
-
Complementary Models: DFDs excel at data transformation but not temporal sequencing or state management. Pair with sequence diagrams, state machines, or BPMN for complete system specification.
Conclusion
Hierarchical Data Flow Diagrams are more than a notation—they are a thinking discipline. Each layer forces you to ask precise questions: Where does this data come from? What transforms it? Where does it persist? What leaves the system? This structured interrogation exposes hidden assumptions, logical gaps, and unstated requirements long before they become expensive bugs.
The initial investment in learning and applying DFD methodology pays exponential returns. In requirements reviews, they eliminate ambiguity. In architecture discussions, they provide a shared visual vocabulary. In onboarding, they serve as self-documenting system maps. Start small, practice consistently, and let the layers reveal the clarity that complex systems demand. The transition from “tangled mess” to “precision blueprint” begins with your first context diagram.