

Introduction: Why PERT Matters in an Uncertain World
1. What is PERT?
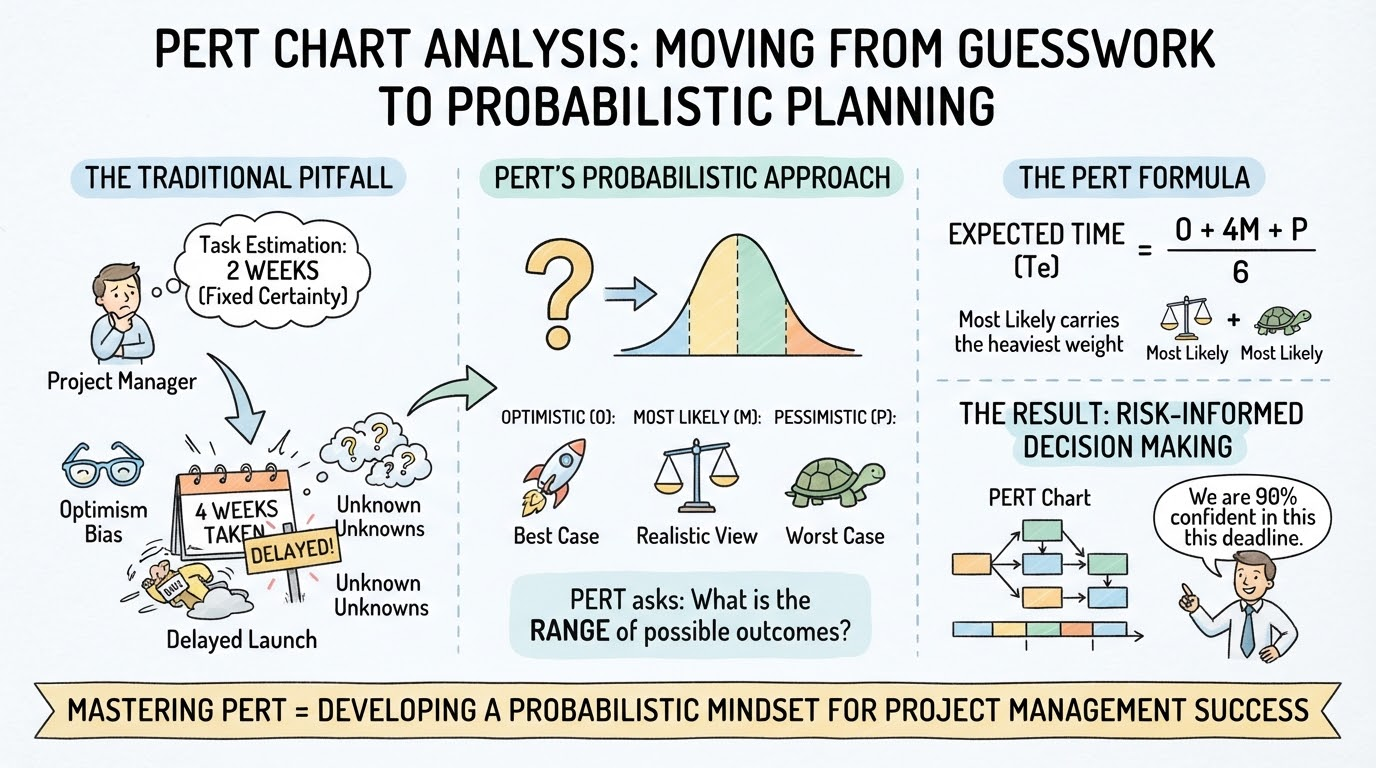
PERT stands for Program Evaluation and Review Technique. Developed by the U.S. Navy in the 1950s for the Polaris missile project, it is a project management tool used to schedule, organize, and coordinate tasks within a project.
Unlike a simple to-do list or a Gantt chart (which focuses on when things happen), PERT focuses on dependencies (what must finish before something else starts) and uncertainty (how long things might take).
The Core Philosophy
PERT assumes that you cannot predict task durations with 100% accuracy. Therefore, instead of one fixed time estimate, PERT uses three estimates to calculate a weighted average. This makes it ideal for complex projects where timelines are uncertain (e.g., R&D, software development, construction).
2. Key Concepts & Vocabulary
Before analyzing, you must understand the building blocks:
| Concept | Definition | Visual Symbol |
|---|---|---|
| Event (Node) | A milestone or point in time marking the start/end of a task. Consumes no time/resources. | Circle or Rectangle |
| Activity | A specific task that consumes time and resources. | Arrow connecting nodes |
| Predecessor | A task that must be completed before another can begin. | Arrow pointing into a node |
| Successor | A task that follows immediately after another. | Arrow leaving a node |
| Critical Path | The longest sequence of dependent tasks. Determines the shortest possible project duration. Zero slack. | Highlighted line |
| Slack (Float) | How long a non-critical task can be delayed without delaying the whole project. | Calculated value |
| Three Estimates | Optimistic ($O$), Most Likely ($M$), Pessimistic ($P$). | Input data |
3. The PERT Formula (The “Analysis” Part)
This is the mathematical heart of PERT analysis. Because human beings are bad at estimating, PERT uses a Beta Distribution approximation:

$$ \text{Expected Time } (T_e) = \frac{O + 4M + P}{6} $$
-
Optimistic ($O$): Everything goes perfectly.
-
Most Likely ($M$): Normal conditions; what usually happens.
-
Pessimistic ($P$): Major delays, problems, worst-case scenario.
-
Why weight $M$ by 4? Statistically, the “most likely” outcome is considered four times more probable than the extremes.
Variance and Standard Deviation
To understand risk, you also calculate variance for each activity:
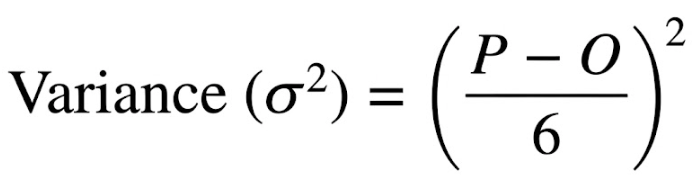
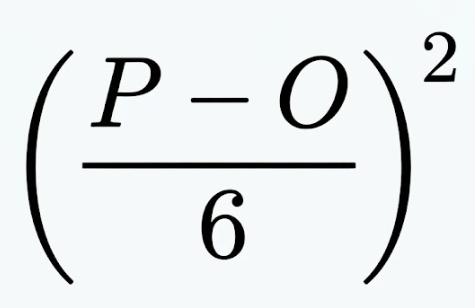
$$ \text{Variance } (\sigma^2) = \left( \frac{P – O}{6} \right)^2 $$
💡 Why does this matter? If your Critical Path has high total variance, your deadline is risky even if the expected time fits. Low variance means your schedule is reliable.
4. Step-by-Step Analysis Process
-
Identify Tasks: List every activity needed.
-
Determine Dependencies: Map out what comes first, second, parallel, etc.
-
Estimate Times: Gather $O$, $M$, and $P$ for each task. Calculate $T_e$.
-
Draw the Network Diagram: Create the visual flowchart.
-
Find All Paths: Trace every route from Start to Finish.
-
Calculate Path Durations: Sum the $T_e$ values for each path.
-
Identify Critical Path: The path with the highest total duration.
-
Calculate Slack: For non-critical paths, determine flexibility.
5. Practical Examples for Different Problems
Example A: Simple Linear Project (Website Launch)
Best for understanding the basic math.
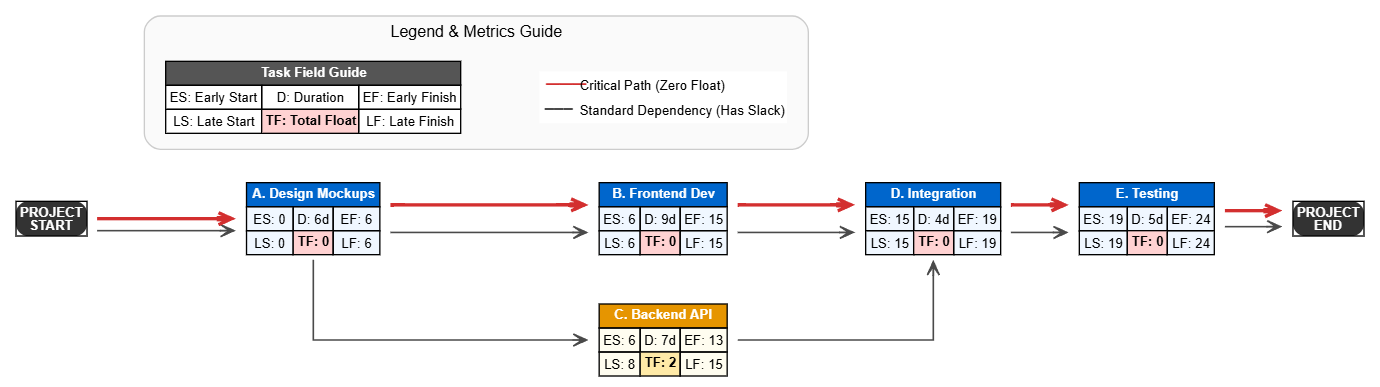
You can use the Visual Paradigm AI Chatbot to generate the Graphviz dot Code
| Task | Description | Predecessor | O | M | P | $T_e$ Calculation | $T_e$ (Days) |
|---|---|---|---|---|---|---|---|
| A | Design Mockups | – | 3 | 5 | 13 | $(3+20+13)/6$ | 6 |
| B | Frontend Dev | A | 5 | 8 | 17 | $(5+32+17)/6$ | 9 |
| C | Backend API | A | 4 | 6 | 14 | $(4+24+14)/6$ | 7 |
| D | Integration | B, C | 2 | 4 | 6 | $(2+16+6)/6$ | 4 |
| E | Testing | D | 3 | 5 | 7 | $(3+20+7)/6$ | 5 |
Path Analysis:
-
Path 1: A → B → D → E = 6 + 9 + 4 + 5 = 24 ✅ CRITICAL PATH
-
Path 2: A → C → D → E = $6 + 7 + 4 + 5 = 22
Insight: Even though Backend (C) takes 7 days vs Frontend (B) at 9 days, both share A, D, and E. The project cannot finish faster than 24 days. Task C has 2 days of slack (24 – 22).
Example B: Complex Parallel Project (Product Manufacturing)
Best for understanding dependencies and multiple critical paths.
Imagine launching a new smartwatch. Tasks can happen simultaneously.
graph LR
    S((Start)) --> A[Design]
    S --> B[Supplier Sourcing]
    A --> C[Prototype Build]
    A --> D[Marketing Plan]
    B --> C
    C --> E[Testing/Certification]
    D --> F[Ad Production]
    E --> G[Mass Production]
    F --> G
    G --> H((Launch))
You can use the Visual Paradigm AI Chatbot to generate the Graphviz dot Code
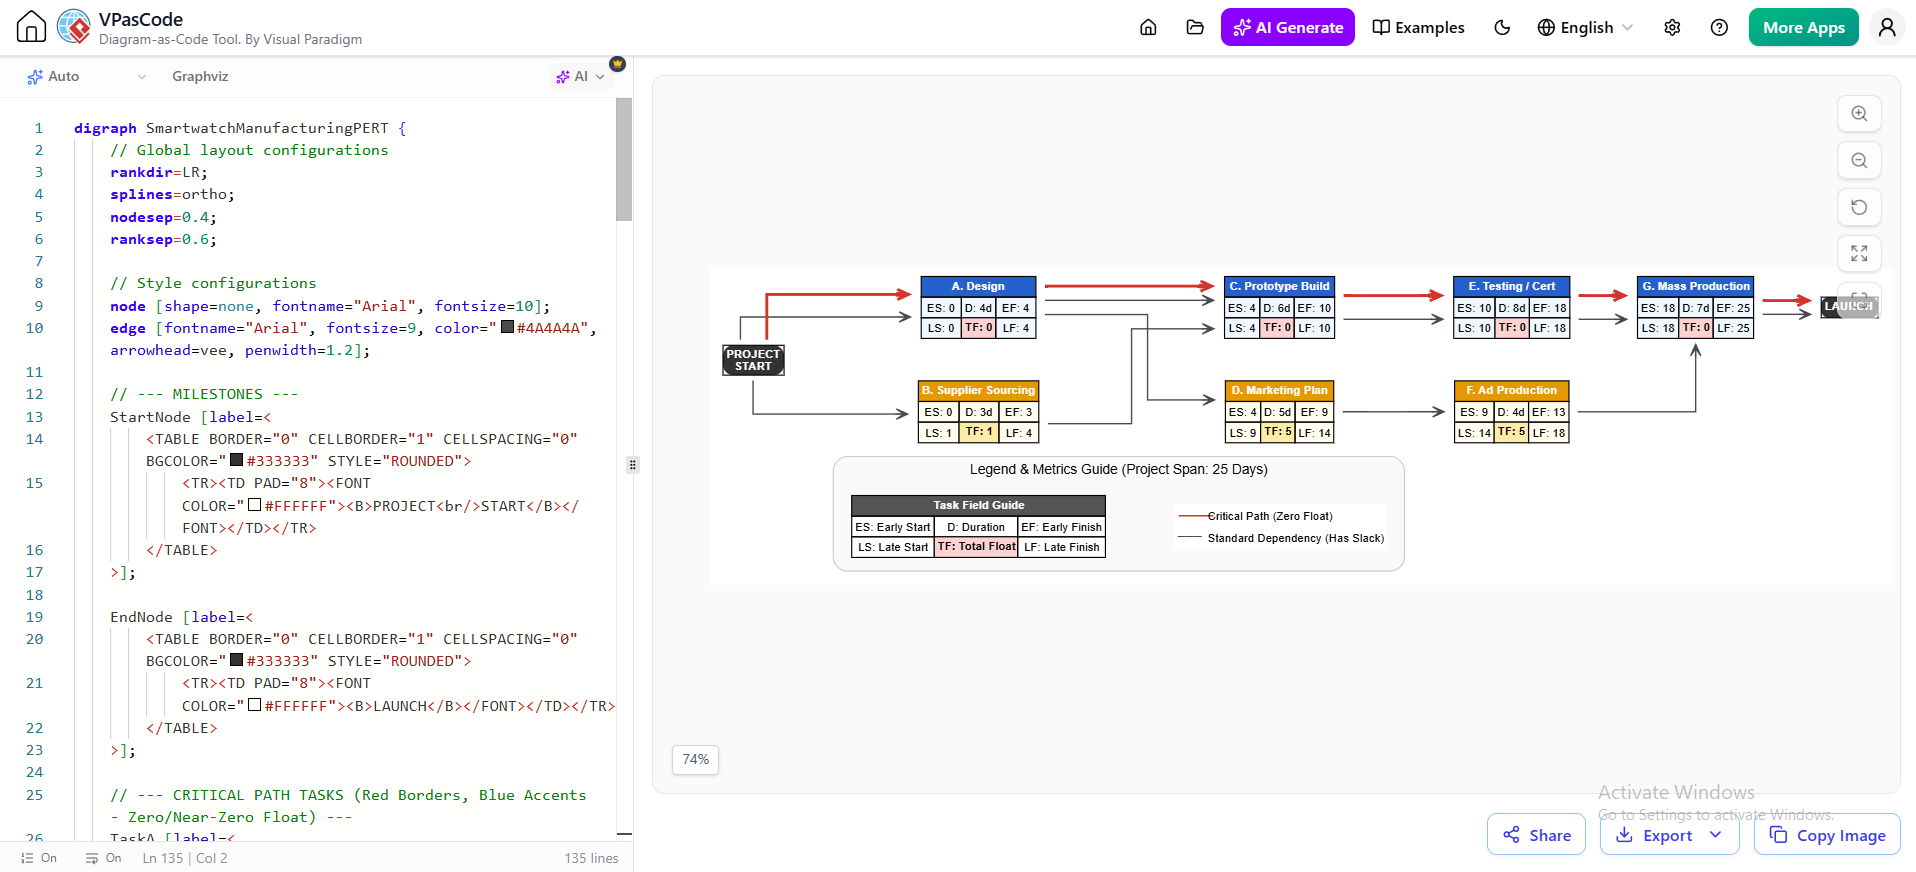
Scenario Data ($T_e$ already calculated):
-
A=4, B=3, C=6, D=5, E=8, F=4, G=7
Path Analysis:
-
S→A→C→E→G→H: 4+6+8+7 = 25 ✅ CRITICAL
-
S→B→C→E→G→H: 3+6+8+7 = 24
-
S→A→D→F→G→H: 4+5+4+7 = 20
Advanced Insight:
-
Path 1 is critical at 25 days.
-
Supplier Sourcing (B) only has 1 day of slack. If supplier negotiations slip by 2 days, Path 2 becomes the new critical path (26 days), and the project is delayed.
-
Marketing (Path 3) has 5 days of slack. You can delay ad production without panic.
Example C: Risk Analysis Application
Best for understanding Variance.
Using Example A’s Critical Path (A→B→D→E):
| Task | O | P | Variance $\left(\frac{P-O}{6}\right)^2$
|
|---|---|---|---|
| A | 3 | 13 | $(10/6)^2 = 2.78$ |
| B | 5 | 17 | $(12/6)^2 = 4.00$ |
| D | 2 | 6 | $(4/6)^2 = 0.44$ |
| E | 3 | 7 | $(4/6)^2 = 0.44$ |
| Total | $\sigma^2_{path} = 7.66$ |
You can use the Visual Paradigm AI Chatbot to generate the Graphviz dot Code
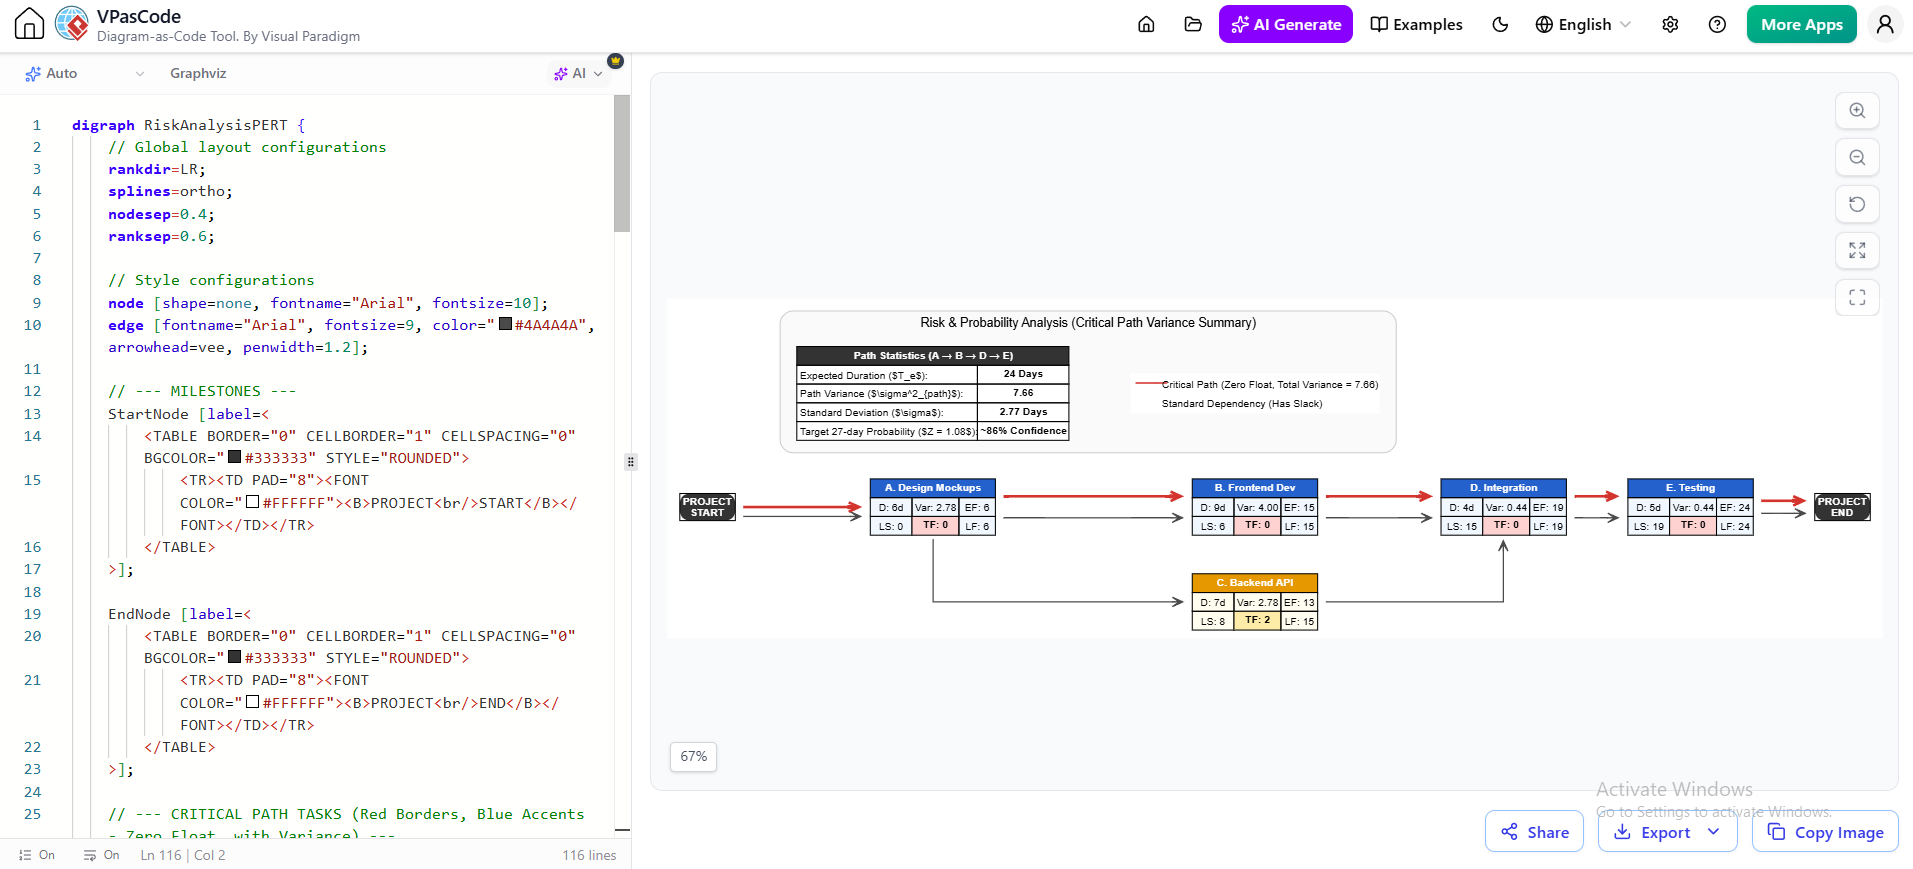
Standard Deviation of Project: $\sqrt{7.66} = 2.77 \text{ days}$

Application: Management asks, “What’s the probability we finish in 27 days?”
-
$Z = \frac{\text{Target} – T_e}{\sigma} = \frac{27 – 24}{2.77} = 1.08$

-
Using a Z-table, $Z=1.08$ corresponds to approximately 86% confidence.
-
Without PERT variance analysis, you’d just say “24 days” and have no idea about risk.
6. Real-World Applications
| Industry | Use Case | Why PERT? |
|---|---|---|
| Construction | Building a bridge | Thousands of dependencies; weather uncertainty requires 3-point estimates. |
| Software Dev | New feature release | Uncertain coding complexity; testing often reveals unknown bugs. |
| Event Planning | Olympics / Concerts | Hard deadlines; thousands of parallel vendors; zero tolerance for critical path failure. |
| Manufacturing | Product redesign | Supply chain variability; prototyping iterations are unpredictable. |
| Research/Academia | Thesis / Clinical Trial | Unknown outcomes; regulatory approval timelines vary wildly. |
7. PERT vs. CPM (Common Confusion)
Beginners often confuse these two:
-
PERT: Probabilistic. Uses 3 time estimates. Focuses on time uncertainty. Best for R&D, first-time projects.
-
CPM (Critical Path Method): Deterministic. Uses 1 fixed time estimate. Focuses on cost/time trade-offs. Best for repetitive projects like construction where durations are well-known.
Modern Note: Most modern software (MS Project, Primavera, Smartsheet) blends both. They call it “PERT” but often let you toggle between single and three-point estimates.
8. Limitations & Pitfalls for Beginners
-
Garbage In, Garbage Out: If your $O$, $M$, $P$ guesses are biased (e.g., always too optimistic), the formula won’t save you.
-
Static Snapshot: PERT is a planning tool. Real projects change. You must update the chart regularly.
-
Ignores Resources: Classic PERT assumes unlimited resources. In reality, two critical tasks might need the same person. (Use Resource Leveling to fix this.)
-
Over-Complexity: Don’t use PERT for a 5-task project. It adds overhead. Use it when there are 20+ tasks with complex dependencies.
-
False Precision: Getting “$T_e = 14.33$ days” doesn’t mean you’ll finish at 2:00 PM on the 14th. Always communicate ranges and confidence levels to stakeholders.
Quick Start Checklist
-
List all activities
-
Define predecessors for each
-
Get three estimates per activity
-
Calculate $T_e$ for each
-
Draw network diagram
-
Identify all paths and sum durations
-
Highlight critical path
-
Calculate variance for risk assessment
-
Communicate timeline WITH confidence level