Skip to content
We Notes – Collaborative AI Insights & Intelligence Hub

We Notes – Collaborative AI Insights & Intelligence Hub

  • Gallery
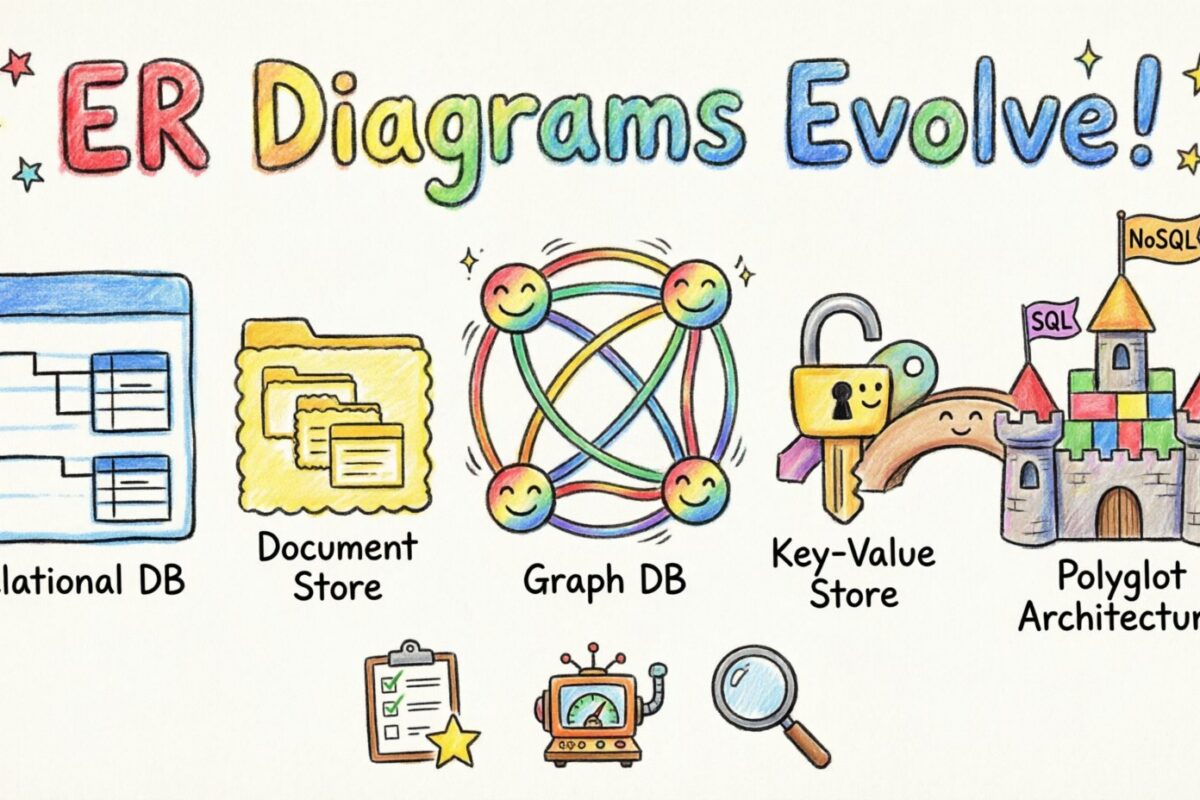
Future Outlook: How ER Diagrams Evolve with NoSQL and Polyglot Persistence Architectures
Posted inERD

Future Outlook: How ER Diagrams Evolve with NoSQL and Polyglot Persistence Architectures

The landscape of data management has shifted dramatically over the last decade. Where relational databases once reigned supreme, a diverse ecosystem of storage engines now coexists. This transition impacts how…
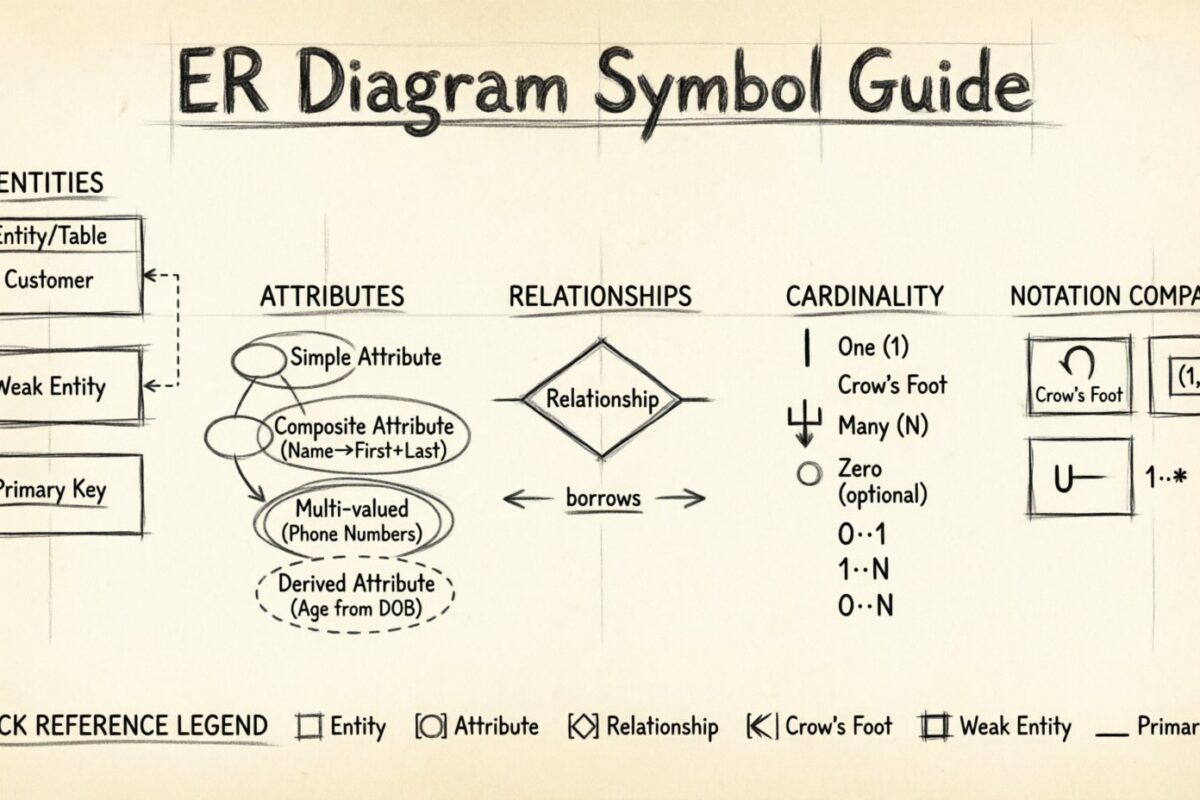
Component Breakdown: Decoding Every Symbol in a Professional ER Diagram
Posted inERD

Component Breakdown: Decoding Every Symbol in a Professional ER Diagram

Entity-Relationship Diagrams serve as the foundational blueprint for database architecture. They translate abstract business requirements into a structured visual language that developers and stakeholders can interpret. Understanding the specific symbols…
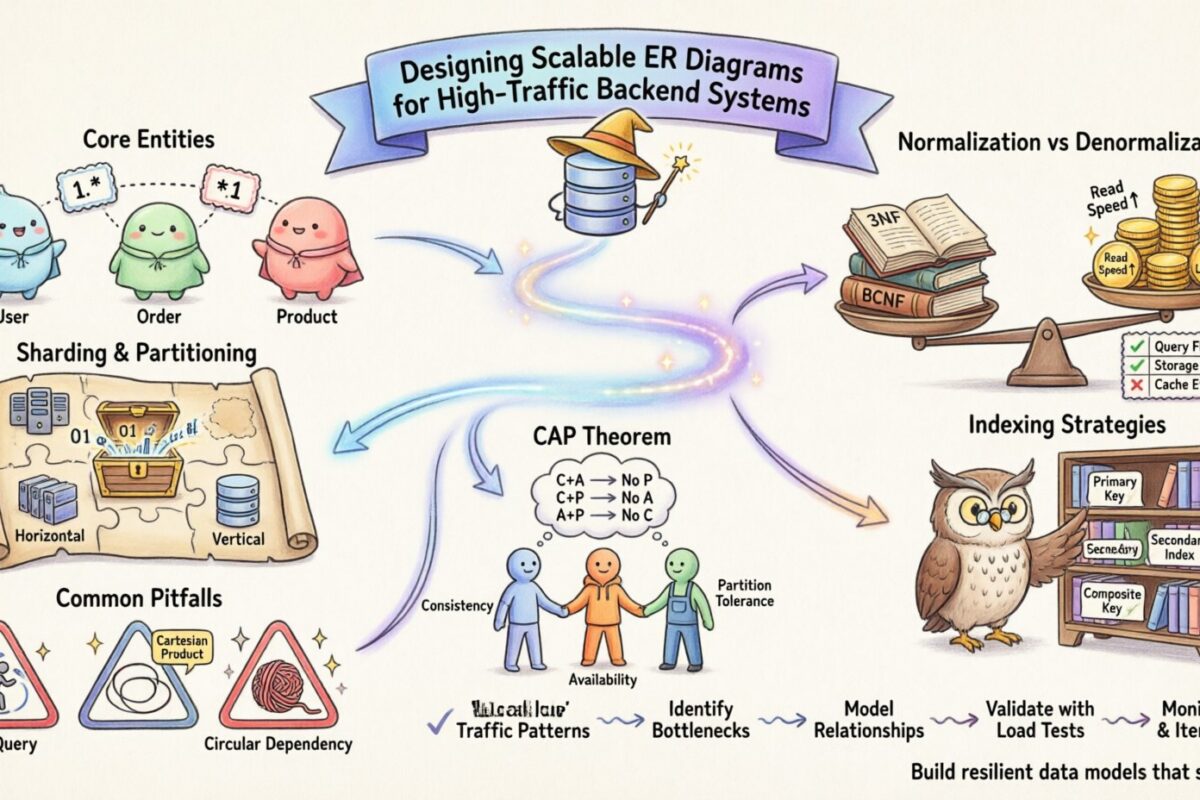
Comprehensive Walkthrough: Designing Scalable ER Diagrams for High-Traffic Backend Systems
Posted inERD

Comprehensive Walkthrough: Designing Scalable ER Diagrams for High-Traffic Backend Systems

Building a robust backend architecture requires more than just writing efficient code; it demands a foundational understanding of how data is structured, stored, and retrieved under pressure. At the heart…
Q&A: Addressing the Hardest Questions About Normalization and Denormalization in ER Diagrams
Posted inERD

Q&A: Addressing the Hardest Questions About Normalization and Denormalization in ER Diagrams

Database design is the backbone of any robust application. When constructing an Entity Relationship Diagram (ERD), two opposing forces shape the schema: normalization and denormalization. Understanding when to apply each…
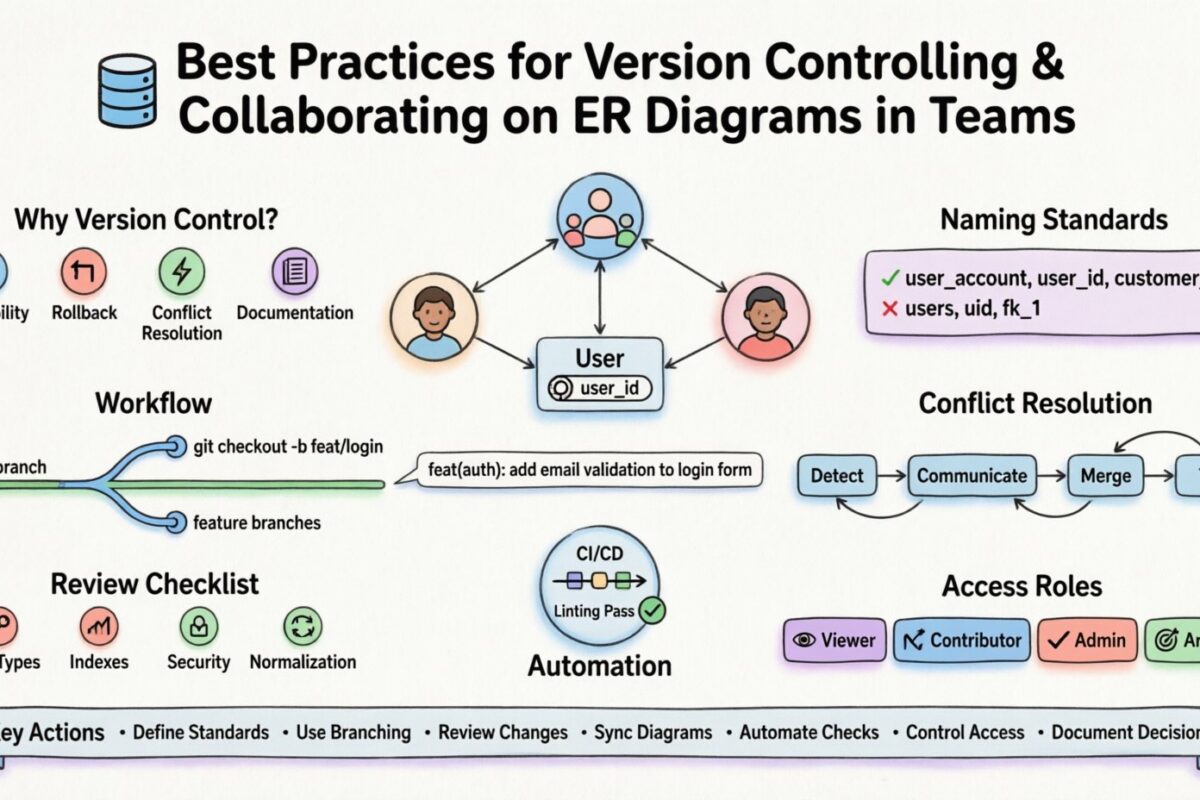
Best Practices for Version Controlling and Collaborating on ER Diagrams in Teams
Posted inERD

Best Practices for Version Controlling and Collaborating on ER Diagrams in Teams

Database schemas act as the foundational contract between application logic and data storage. When a team works on a complex system, the Entity-Relationship Diagram (ERD) becomes the shared source of…
Tutorial: Reverse Engineering a Messy Database into a Clean ER Diagram Structure
Posted inERD

Tutorial: Reverse Engineering a Messy Database into a Clean ER Diagram Structure

Database schemas often evolve organically rather than through intentional design. Over time, rapid development cycles, lack of documentation, and changing business requirements lead to complex, difficult-to-navigate structures. Many organizations find…
Myth-Buster: Do ER Diagrams Really Become Obsolete in the Age of Agile?
Posted inERD

Myth-Buster: Do ER Diagrams Really Become Obsolete in the Age of Agile?

Software development has evolved significantly over the last few decades. The shift from rigid Waterfall methodologies to flexible Agile frameworks changed how teams build products. With a focus on speed,…
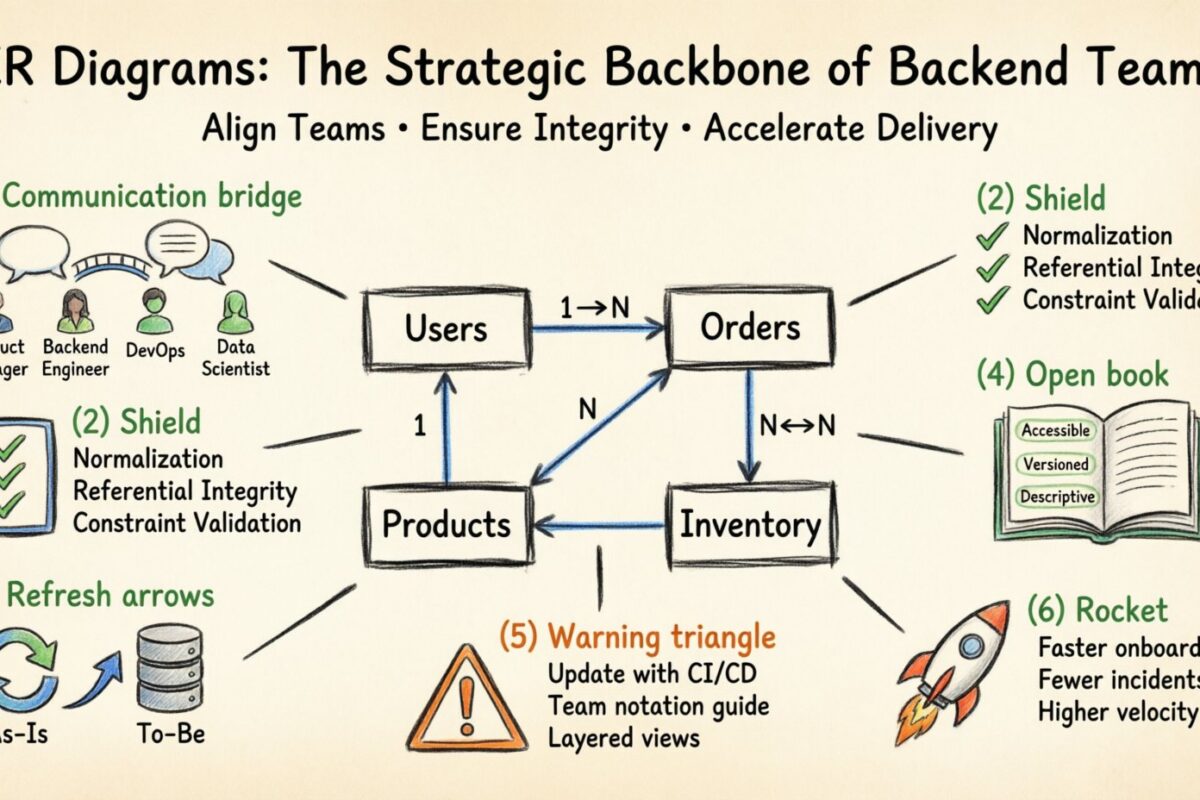
The Strategic Value of ER Diagrams in Large-Scale Backend Development Teams
Posted inERD

The Strategic Value of ER Diagrams in Large-Scale Backend Development Teams

In the architecture of complex software systems, the database schema serves as the foundational bedrock upon which all application logic rests. For large-scale backend development teams, where dozens of engineers…
The Hidden Cost of Poor ER Diagrams: A Post-Mortem Analysis of Database Refactoring
Posted inERD

The Hidden Cost of Poor ER Diagrams: A Post-Mortem Analysis of Database Refactoring

When a software system begins to scale, the data layer often becomes the most critical bottleneck. While application code can be rewritten and front-end interfaces redesigned, the database schema represents…
Best Practices for ER Diagrams: Avoiding Normalization Pitfalls in Intermediate Projects
Posted inERD

Best Practices for ER Diagrams: Avoiding Normalization Pitfalls in Intermediate Projects

Designing a robust data structure is the backbone of any successful software application. When projects move beyond simple prototypes and enter the intermediate phase, the complexity of data relationships increases…

Posts pagination

Previous page 1 … 5 6 7 8 9 … 20 Next page
Language
de_DEes_ESfr_FRhi_INid_IDjapl_PLpt_PTru_RUvizh_CNzh_TW

Categories

  • AI
  • AI Diagram
  • BPMN
  • Business Motivation Model
  • C4 Model
  • DFD
  • ERD
  • Mind Map
  • OpenDocs
  • PERT Analysis
  • Root Cause Analysis
  • SysML
  • TOGAF
  • UML
  • Uncategorized
  • Unified Platform
  • User Story
  • UX Design
  • VP Unified Platform
  • VPasCode

Recent Posts

  • PlantUML Flowchart Guide Using Visual Paradigm Chatbot and VPasCode Tool
  • Building Markmaps with the Visual Paradigm Chatbot: A Complete Guide
  • Simplifying BPMN Decision Logic: Replacing Complex Gateways with Clearer Models
  • Decoding the Flow: A Beginner’s Guide to Reading BPMN Diagrams with Visual Paradigm
  • BPMN Modeling for Beginners: A Step-by-Step Guide

Archives

  • November 2026
  • August 2026
  • July 2026
  • June 2026
  • April 2026
  • March 2026
You May Have Missed
Posted inAI DFD

PlantUML Flowchart Guide Using Visual Paradigm Chatbot and VPasCode Tool

Building Markmaps with the Visual Paradigm Chatbot: A Complete Guide
Posted inMind Map

Building Markmaps with the Visual Paradigm Chatbot: A Complete Guide

Simplifying BPMN Decision Logic: Replacing Complex Gateways with Clearer Models
Posted inAI BPMN VPasCode

Simplifying BPMN Decision Logic: Replacing Complex Gateways with Clearer Models

Posted inAI BPMN

Decoding the Flow: A Beginner’s Guide to Reading BPMN Diagrams with Visual Paradigm

Copyright 2026 — We Notes – Collaborative AI Insights & Intelligence Hub. All rights reserved.
Scroll to Top