


Introduction
Every software project begins with a vision — but far too often, that vision gets lost in a fog of fragmented requirements, endless documentation, and misaligned expectations. System analysts find themselves paralyzed by ambiguity. Development teams spin their wheels on rework. Projects slip behind schedule, budgets balloon, and stakeholders lose confidence.
The root cause? A failure to clearly communicate how data moves through a system.
Enter the Hierarchical Data Flow Diagram (DFD) — one of the most powerful yet underappreciated tools in the systems analyst’s toolkit. A DFD is a visual representation of the flow of data through an information system or business process. By organizing complexity into layered, top-down diagrams, hierarchical DFDs transform vague ideas into precise, actionable blueprints that every stakeholder — from executives to developers — can understand and act upon.
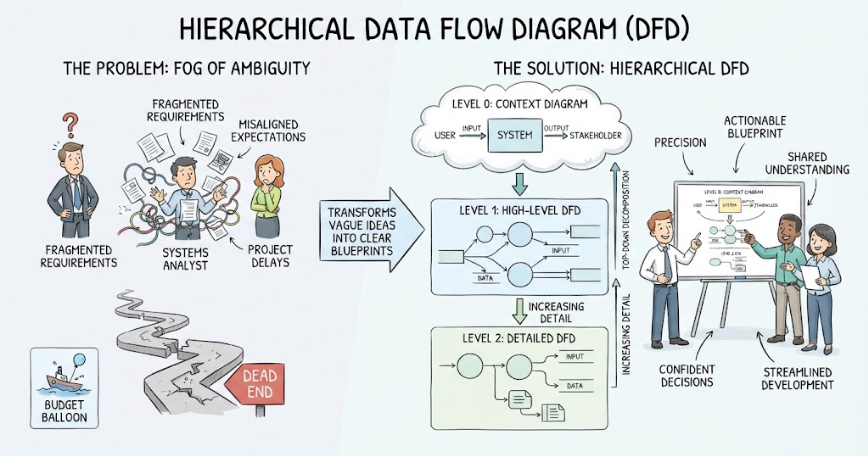
This guide will walk you through everything you need to know about hierarchical DFDs: why they matter, how they’re structured, the notation you need to master, and how to apply them to real-world systems.
Part 1: The Challenge — From Vague to Clear
The Problem with Unstructured Requirements
Before we dive into the solution, it’s worth understanding the pain that hierarchical DFDs are designed to solve. Consider a typical scenario:
-
Fragmented Requirements: Stakeholders across departments provide conflicting or incomplete specifications. Business rules live in someone’s head, scattered across emails, or buried in outdated documents.
-
Endless Documentation: Teams produce hundreds of pages of text-based specifications that no one reads fully — and that quickly become obsolete the moment requirements change.
-
The Paralyzed Analyst: The system analyst, overwhelmed by contradictory inputs, struggles to form a coherent picture of what the system should actually do.
-
Confused Developers: Without a clear map of data movement, developers make assumptions — and those assumptions lead to costly rework.
-
Project Delays and Rework: Miscommunication cascades through the project lifecycle, resulting in missed deadlines, budget overruns, and frustrated teams.
These challenges aren’t hypothetical. They represent the daily reality for countless development teams worldwide. The fundamental issue is that natural language and text-based specifications are inherently ambiguous when describing complex data interactions. What’s needed is a visual, structured, and standardized way to represent system behavior — and that’s exactly what hierarchical DFDs provide.
Part 2: The Solution — Hierarchical DFDs and Top-Down Decomposition
What Is a Data Flow Diagram?
A Data Flow Diagram (DFD) is a graphical representation that illustrates how data flows through a system — showing the processes that transform data, the stores where data resides, the external entities that interact with the system, and the pathways along which data travels. Unlike flowcharts, which focus on control flow and decision logic, DFDs focus purely on data movement, making them ideal for understanding system functionality at a conceptual level.
The Power of Top-Down Decomposition
The genius of hierarchical DFDs lies in their layered structure. Rather than trying to capture an entire system in a single, overwhelming diagram, hierarchical DFDs break the system down progressively — from a bird’s-eye view all the way down to granular subprocesses. This approach is called top-down decomposition, and it follows a clear leveling structure:
Level 0: The Context Diagram
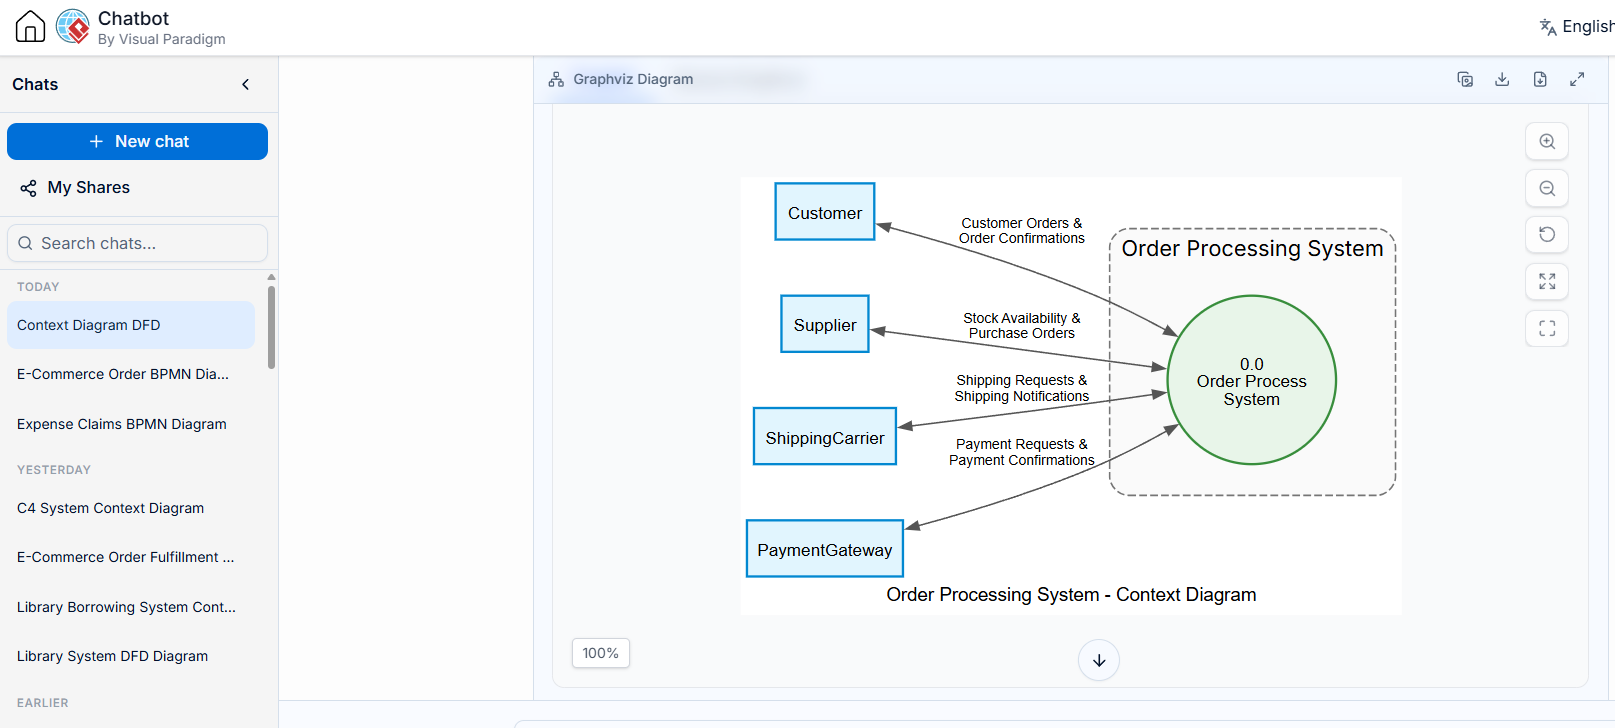
The Context Diagram (also called a Level 0 DFD) is the highest-level view of the system. It represents the entire system as a single process and shows only its interactions with external entities — the people, organizations, or other systems that send data to or receive data from the system.
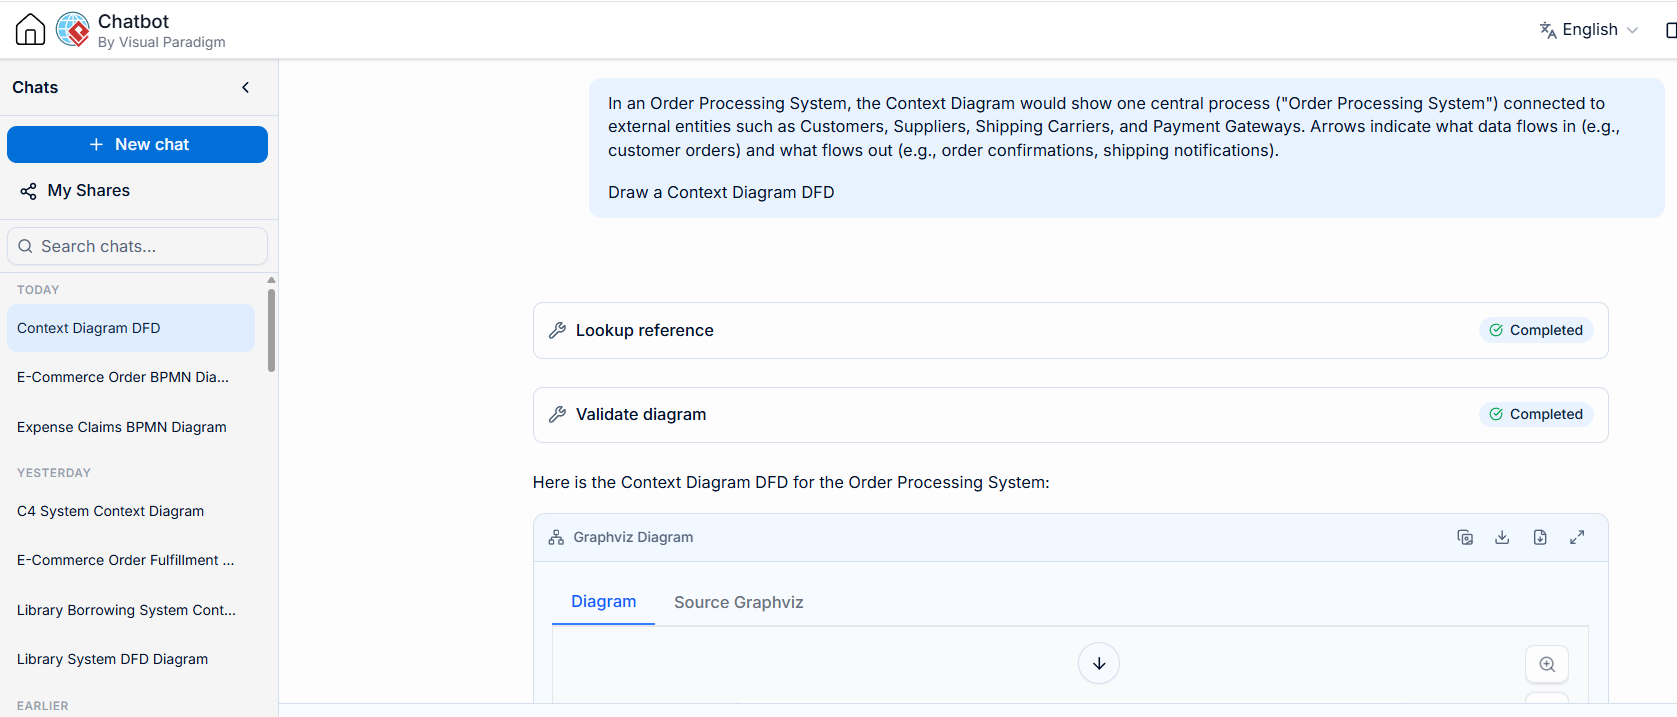
Example: In an Order Processing System, the Context Diagram would show one central process (“Order Processing System”) connected to external entities such as Customers, Suppliers, Shipping Carriers, and Payment Gateways. Arrows indicate what data flows in (e.g., customer orders) and what flows out (e.g., order confirmations, shipping notifications).
The Context Diagram answers the question: “What is this system, and who does it interact with?”
Level 1: Diagram 0 — Major Processes
At Level 1, the single process from the Context Diagram is decomposed into its major subprocesses. This is where the system’s core functions begin to take shape. Each subprocess is numbered (e.g., 1.0, 2.0, 3.0), and data stores are introduced to show where data is persisted.
Example: Continuing with the Order Processing System, Level 1 might reveal:
Process 1.0 — Validate Order: Checks customer information and product availability.
Process 2.0 — Process Order: Calculates totals, applies discounts, and generates invoices.
Process 3.0 — Fulfill Order: Coordinates inventory allocation and shipping.
Data stores such as Customer Info (D1), Product Inventory (D2), and Order Records (D3) appear at this level, showing where data is read from and written to.
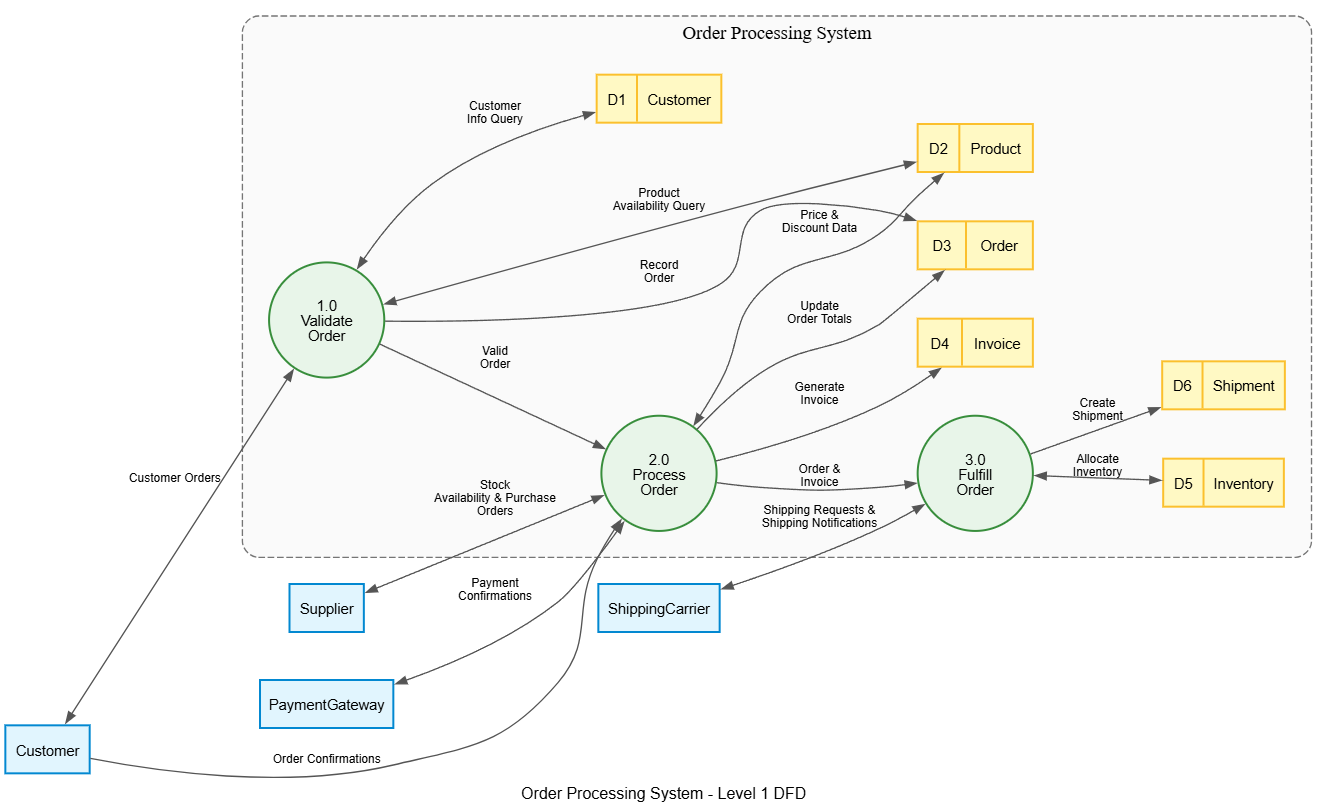
Level 1 answers the question: “What are the major things this system does?”
Level 2+: Child Diagrams — Detailed Subprocesses
At Level 2 and beyond, individual processes from Level 1 are further decomposed into child diagrams with even more granular subprocesses. Each child diagram “zooms in” on a specific parent process, revealing the detailed steps involved.
Example: Process 2.0 (“Process Order”) from Level 1 might be decomposed at Level 2 into:
Process 2.1 — Check Inventory: Verifies stock levels against the Product Inventory data store.
Process 2.2 — Update Database: Writes the confirmed order to the Order Records data store and adjusts inventory counts.
Process 2.3 — Generate Invoice: Calculates taxes, applies promotions, and produces the final invoice.
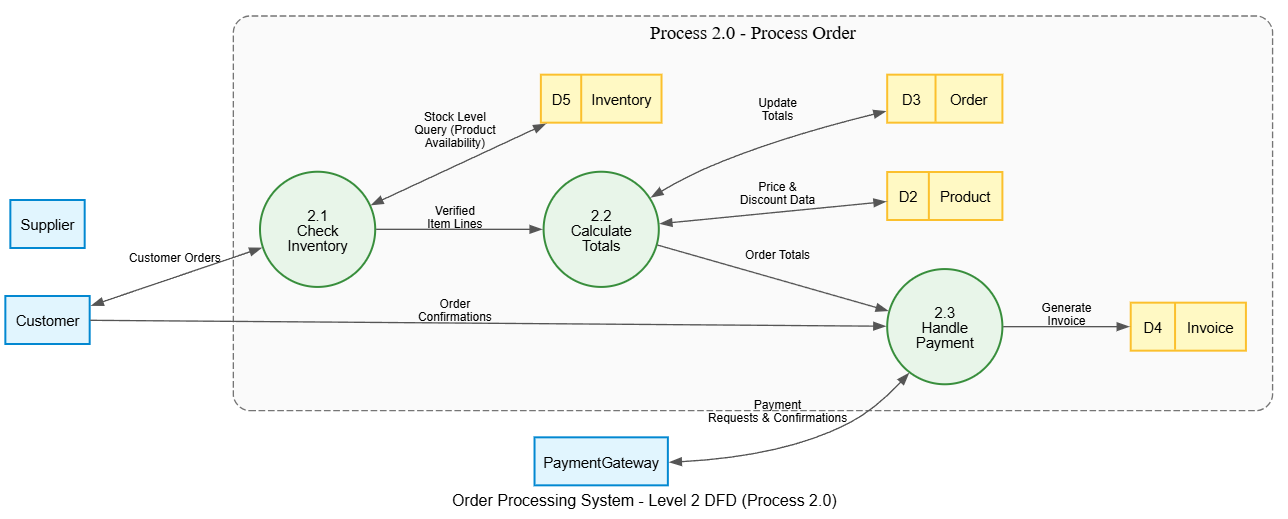
Level 2+ answers the question: “Exactly how does each major function work, step by step?”
The Balancing Rule
A critical principle of hierarchical DFDs is balancing: the data flows entering and leaving a parent process must match the data flows entering and leaving its corresponding child diagram. This ensures consistency across levels and prevents information from being “lost” or “invented” during decomposition.
Part 3: The Framework — DFD Notation and Symbols
Standardized Notation: The Four Core Symbols
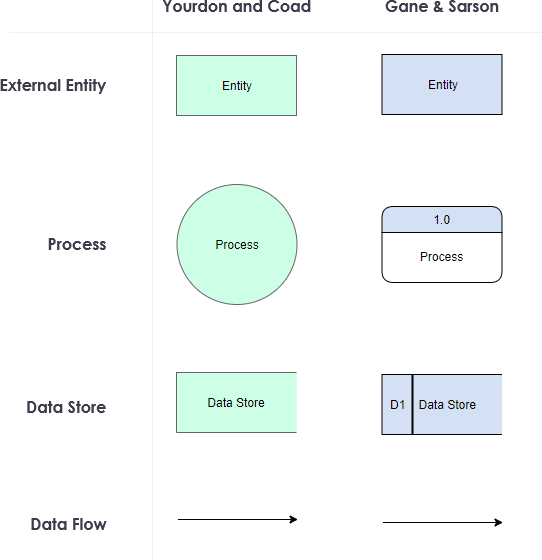
One of the greatest strengths of DFDs is their standardized notation. Every DFD uses just four fundamental symbols, making them easy to learn and universally understood:
| Symbol | Name | Shape | Description |
|---|---|---|---|
| ○ / Rounded Rectangle | Process | Circle (Yourdon/DeMarco) or rounded rectangle (Gane/Sarson) | Represents a transformation — an action that takes input data and produces output data. Labeled with a verb phrase (e.g., “Validate Order”). |
| ▭ Open Rectangle | Data Store | Two parallel lines or an open-ended rectangle | Represents a repository where data is stored for later use — a database, file, or table. Labeled with a noun (e.g., “Customer Info”). |
| → Arrow | Data Flow | Directed arrow | Represents the movement of data between processes, data stores, and external entities. Labeled with the name of the data being transferred (e.g., “Order Details”). |
| □ Rectangle | External Entity | Square or rectangle | Represents a source or destination of data outside the system boundary — a person, organization, or external system Labeled with a noun (e.g., “Customer”). |
Two Notation Standards
There are two widely used notation standards for DFDs:
-
Yourdon and DeMarco Notation: Uses circles for processes. This is the more traditional academic notation.
-
Gane and Sarson Notation: Uses rounded rectangles for processes. This is more common in professional and enterprise settings.
Both notations use the same four core concepts — only the shapes differ slightly. The key is to pick one standard and stay consistent throughout your diagrams.
Part 4: Key Concepts Deep Dive
Concept 1: Strings Complexity Through Layering
Hierarchical DFDs tame complexity by ensuring that each diagram level presents only the information relevant to that level of abstraction. A stakeholder reviewing the Context Diagram doesn’t need to know about database updates — they just need to understand the system’s boundaries and external interactions. A developer working on inventory management needs the Level 2 detail but doesn’t need to see the payment gateway integration.
This layering means that complexity is managed, not eliminated — every detail exists somewhere in the hierarchy, but it’s surfaced only when and where it’s needed.
Concept 2: Focus on Data Flow, Not Control Flow
Unlike flowcharts or activity diagrams, DFDs deliberately ignore sequencing, timing, and decision logic. They answer “what data goes where?” rather than “in what order do things happen?” This focus makes DFDs exceptionally good at:
-
Identifying missing data dependencies
-
Revealing redundant data storage
-
Clarifying system boundaries
-
Exposing integration points with external systems
Concept 3: Improves Communication Across Teams
Because DFDs use simple, standardized symbols and focus on data rather than implementation details, they serve as a universal language between business stakeholders, system analysts, designers, and developers. A business manager can review a Context Diagram and confirm whether the right external entities are captured. A database designer can examine Level 1 data stores and plan the schema. A developer can use Level 2 diagrams as a specification for building individual modules.
Concept 4: Precision and Actionable Specifications
The ultimate output of a well-constructed hierarchical DFD set is a precise, actionable specification. Every process has defined inputs and outputs. Every data store has identified readers and writers. Every external entity has documented interactions. This precision dramatically reduces ambiguity, which in turn reduces rework, accelerates development, and improves system quality.
Part 5: Step-by-Step Example — Building a Hierarchical DFD for an Order Processing System
Let’s walk through a complete example to solidify these concepts.
Step 1: Create the Context Diagram (Level 0)
Start by identifying the system as a single process and mapping its external entities:
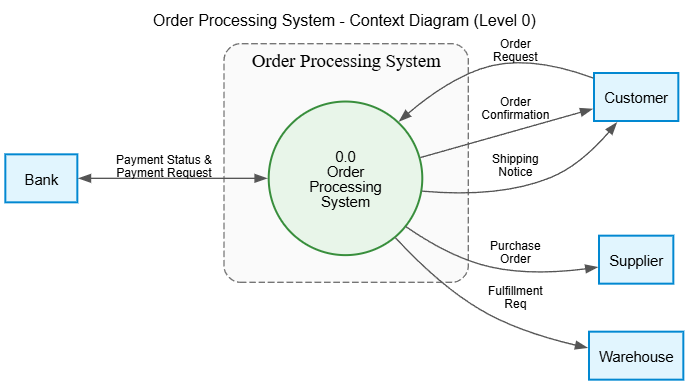
External Entities: Customer, Supplier, Bank, Warehouse
Single Process: Order Processing System
Data Flows: Order requests, confirmations, purchase orders, payment requests/statuses, fulfillment requests, shipping notices
Step 2: Decompose into Level 1
Break the single process into major functions:
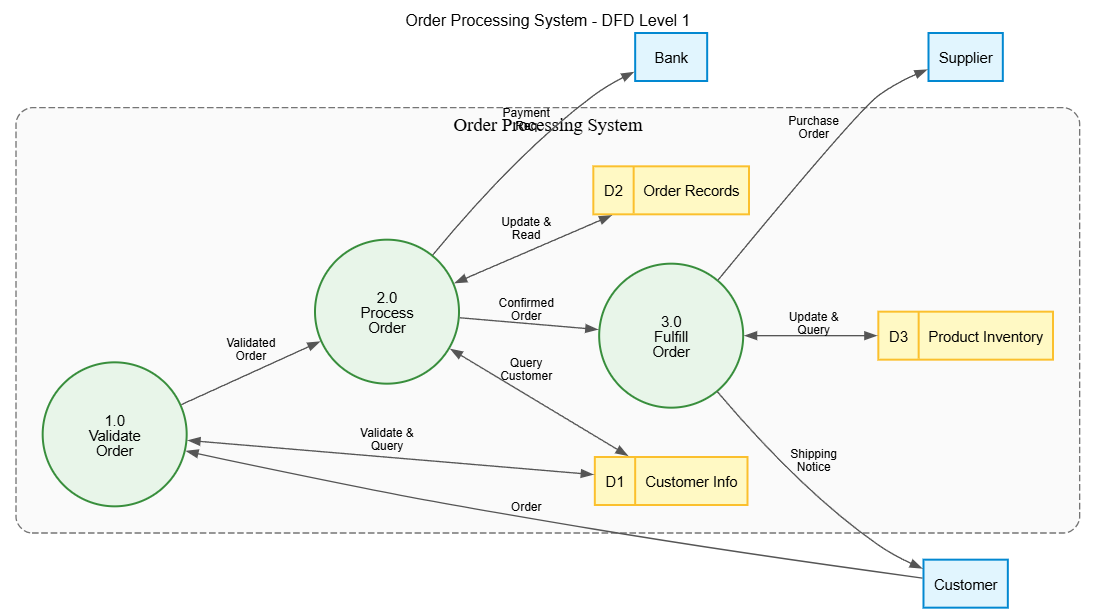
Processes: 1.0 Validate Order, 2.0 Process Order, 3.0 Fulfill Order
Data Stores: D1 Customer Info, D2 Order Records, D3 Product Inventory
Step 3: Decompose Process 2.0 into Level 2
Zoom into “Process Order” for detailed substeps:
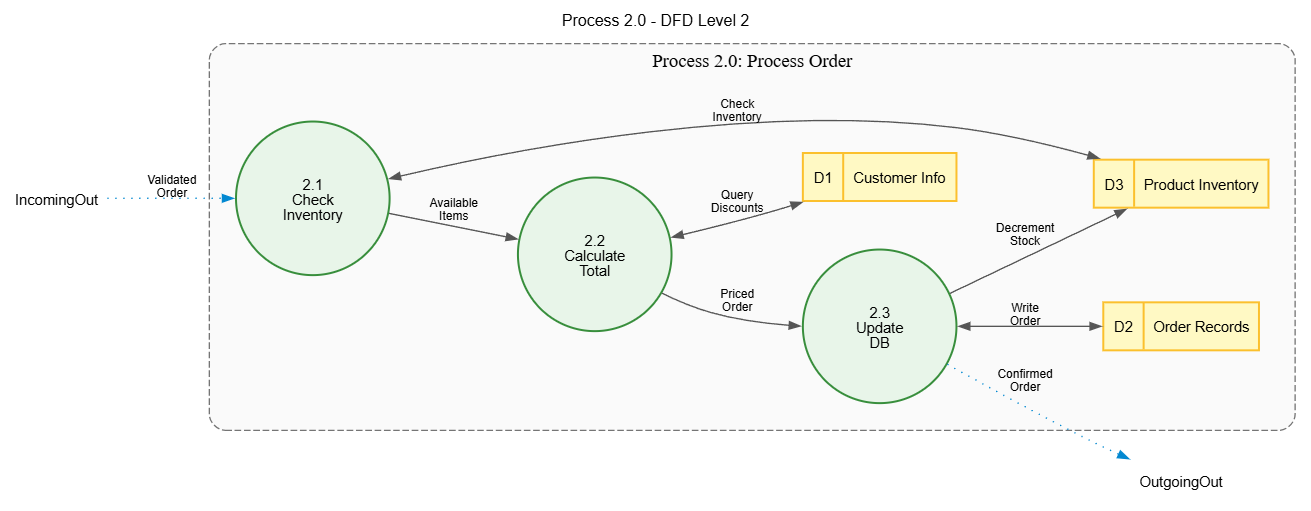
Child Processes: 2.1 Check Inventory, 2.2 Calculate Total, 2.3 Update Database
Step 4: Validate Balancing
Verify that the inputs and outputs of Process 2.0 at Level 1 (Validated Order in → Confirmed Order out, plus data store interactions) are fully accounted for in the Level 2 child diagram. ✅
Part 6: Best Practices for Creating Hierarchical DFDs
-
Start at the top. Always begin with the Context Diagram. Resist the urge to jump into details before you’ve established the system boundary.
-
Name processes with verbs. Every process should be labeled with a clear verb phrase (e.g., “Validate Order,” not “Order Validation”). This emphasizes that processes do something.
-
Name data flows with nouns. Label arrows with the actual data being transferred (e.g., “Customer Order,” not “Send Data”).
-
Limit processes per diagram. Aim for 5–9 processes per diagram level. More than that, and the diagram becomes hard to read — decompose further instead.
-
Every process must have at least one input and one output. A process with only inputs is a “black hole.” A process with only outputs is a “miracle.” Both indicate modeling errors.
-
Data stores must be accessed by at least one process. An orphaned data store serves no purpose in the diagram.
-
Don’t show control flow. Avoid including triggers, timers, or sequential logic. If you need that, use a flowchart or activity diagram alongside your DFD.
-
Iterate and validate with stakeholders. Use the Context Diagram to validate scope with business owners. Use Level 1 to validate functionality with domain experts. Use Level 2+ to validate implementation details with developers.
Part 7: When to Use Hierarchical DFDs
Hierarchical DFDs are particularly valuable in the following scenarios:
-
New system design: When building a system from scratch, DFDs help establish a clear, shared understanding of what the system will do before any code is written.
-
System reengineering: When modernizing a legacy system, DFDs help document the existing data flows before redesigning them.
-
Requirements elicitation: DFDs serve as excellent conversation starters with stakeholders, surfacing missing requirements and hidden assumptions.
-
Integration planning: When connecting multiple systems, Context Diagrams clarify boundaries and data exchange points.
-
Documentation and knowledge transfer: Hierarchical DFDs provide living documentation that new team members can study at their own pace — starting high-level and drilling down as needed.
Conclusion
Hierarchical Data Flow Diagrams are far more than an academic exercise — they are a practical, battle-tested framework for transforming vague, fragmented requirements into precise, actionable system specifications. By embracing top-down decomposition, standardized notation, and a relentless focus on data flow, hierarchical DFDs address the core communication challenges that plague software projects.
The journey from a paralyzed analyst staring at contradictory requirements to a development team executing against crystal-clear specifications is bridged by one thing: a well-constructed set of hierarchical DFDs.
Start with the Context Diagram to define your system’s boundaries. Decompose into Level 1 to reveal major processes. Drill into Level 2 and beyond for implementation-ready detail. Balance every level. Validate with stakeholders. And watch as complexity yields to clarity — one diagram at a time.
In a world where miscommunication is the single greatest driver of project failure, hierarchical DFDs offer something invaluable: a shared visual language that turns chaos into blueprints, and blueprints into working systems.
References
-
Turning Text into a Data Flow Diagram in Minutes with Visual Paradigm: An official guide on using Visual Paradigm’s AI to generate professional, standards-compliant DFDs from simple natural language descriptions.
-
AI DFD Generator: Automate DFD Creation & Validation: Explores how AI automation can reduce DFD creation and validation time by up to 70%, highlighting Visual Paradigm’s AI for error detection and enforcing consistency rules.
-
How to Create DFD with Visual Paradigm Desktop: A detailed step-by-step tutorial on creating, decomposing, and balancing Data Flow Diagrams using the desktop application.
-
Mastering Data Flow Diagrams with Visual Paradigm: A Step-by-Step Guide: A practical guide that uses real-world examples like online shopping and library systems to demonstrate DFD creation.
-
AI Timing Diagram Generator | Visual Paradigm AI: Showcases Visual Paradigm’s broader AI capabilities for generating various diagrams, such as timing diagrams, using natural language prompts.
-
Visual Paradigm 18.1: A New Era of Unified Ecosystems and AI-Driven Innovation: An overview of the Visual Paradigm 18.1 release, introducing the unified ecosystem that integrates VPasCode, AI Chatbot, and AI Presentation Studio.
-
AI Component Diagram Generator | Visual Paradigm AI: Details the AI-powered generator for UML component diagrams, highlighting its deep integration that produces editable models for code engineering.
-
New AI Diagram Generator – Visual Paradigm Product Updates: The official announcement of Visual Paradigm’s AI Diagram Generator, which instantly creates diagrams like Use Case, Class, and Sequence diagrams from a text prompt.