


Introduction
In the realm of software engineering and business process modeling, capturing the dynamic behavior of a system is just as critical as defining its static structure. Unified Modeling Language (UML) provides a standardized vocabulary for this purpose, and among its suite of diagrams, the Activity Diagram stands out as the premier tool for visualizing workflows.
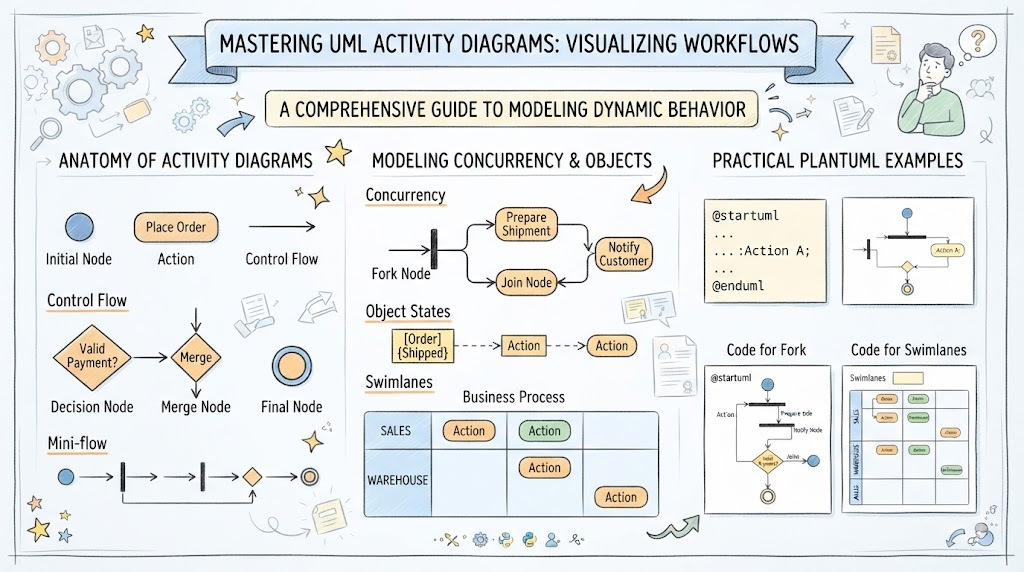
Whether you are documenting a complex business rule, designing a multithreaded software algorithm, or mapping out a user journey, Activity Diagrams bridge the gap between abstract requirements and concrete implementation. This comprehensive guide explores the anatomy of Activity Diagrams, demonstrates how to model concurrency and object states, and provides practical PlantUML examples to help you master this essential UML artifact.
Key Concepts of Activity Diagrams
Before diving into complex examples, it is vital to understand the core notation. Activity Diagrams are essentially advanced flowcharts with specific UML semantics for parallelism and object flow.
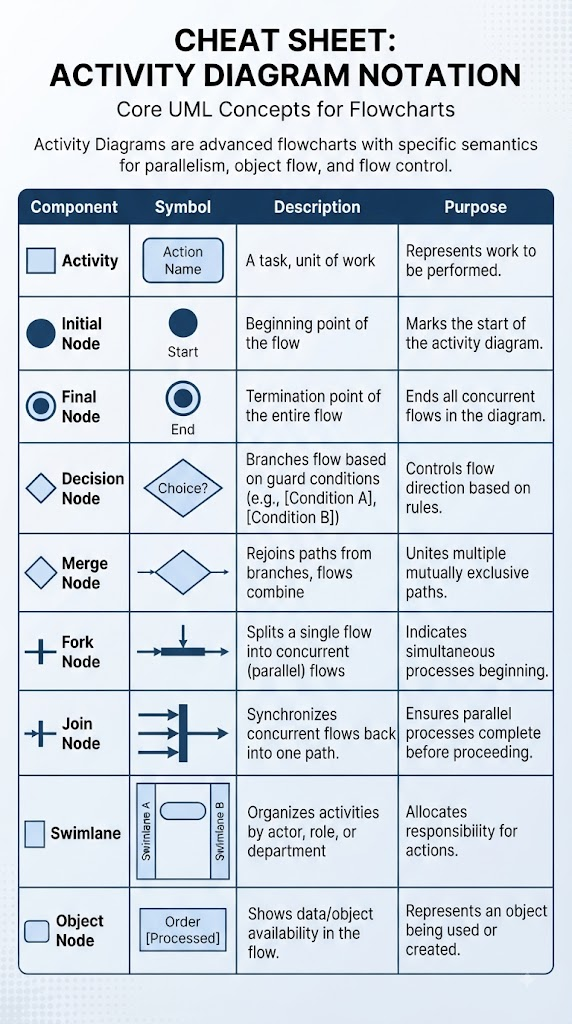
| Component | Symbol Description | Purpose |
|---|---|---|
| Activity | Rectangle with rounded corners | Represents a unit of work, task, or action. |
| Initial Node | Filled black circle | The starting point of the workflow. |
| Final Node | Bullseye (circle with dot) | Represents the termination of the entire activity. |
| Decision Node | Diamond | Branches control flow based on guard conditions (e.g., if/else). |
| Merge Node | Diamond | Rejoins multiple mutually exclusive paths into one flow. |
| Fork Node | Thick horizontal/vertical bar | Splits a single flow into concurrent parallel flows. |
| Join Node | Thick horizontal/vertical bar | Synchronizes concurrent flows back into a single path. |
| Swimlane | Vertical or horizontal partition | Assigns responsibility to specific actors, classes, or departments. |
| Object Node | Rectangle with state [state] |
Shows data/object availability at a specific point in the flow. |
Modeling Concurrency and Conditional Flows
One of the distinct advantages of Activity Diagrams over standard flowcharts is their ability to model concurrency. In real-world systems, tasks often happen simultaneously, or certain tasks only trigger under specific conditions within a parallel branch.
Theater Box Office Workflow Example
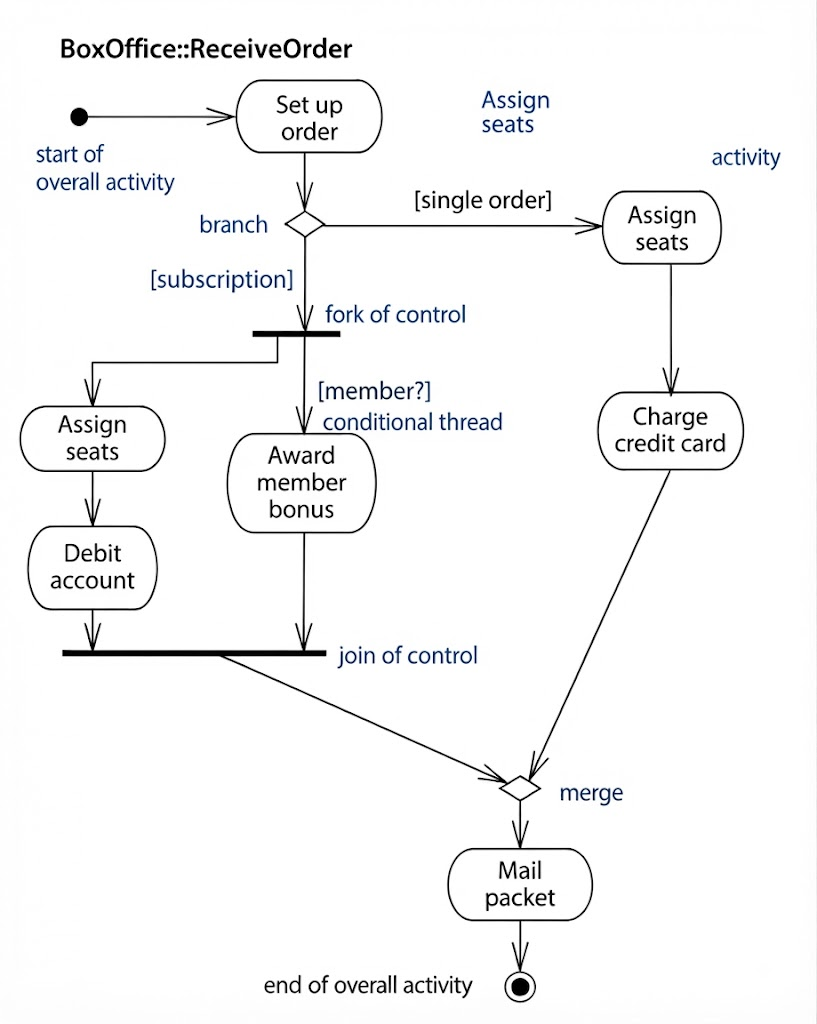
The diagram below illustrates a workflow detailing the various steps involved in processing an order at a theater box office. This process encompasses a branching decision and subsequent merging based on whether the order pertains to a subscription or individual tickets. Additionally, there is a forking mechanism that initiates concurrent activities that conceptually occur simultaneously, although their actual execution may or may not overlap. This concurrency is subsequently terminated by a matching join point.
Understanding the Logic
-
Conditional Threads: Within this process, there is a conditional thread emerging from the fork point. This thread evaluates whether the subscriber is a member, serving as a guard condition. It only initiates if the guard condition is met.
-
Asymmetric Synchronization: If the subscriber is not a member, only one thread is activated (seat assignment and account debiting), without waiting for synchronization at the join point for the bonus award thread.
-
Execution Order: In cases where only one person is involved, concurrent activities can be executed in any order presuming they cannot be performed physically simultaneously, though the model permits it. However, dependencies still exist; for instance, debiting the account cannot occur until after seats have been assigned.
PlantUML Representation: Theater Workflow
Below is a PlantUML representation of the logic described above, demonstrating fork/join bars and guarded transitions.
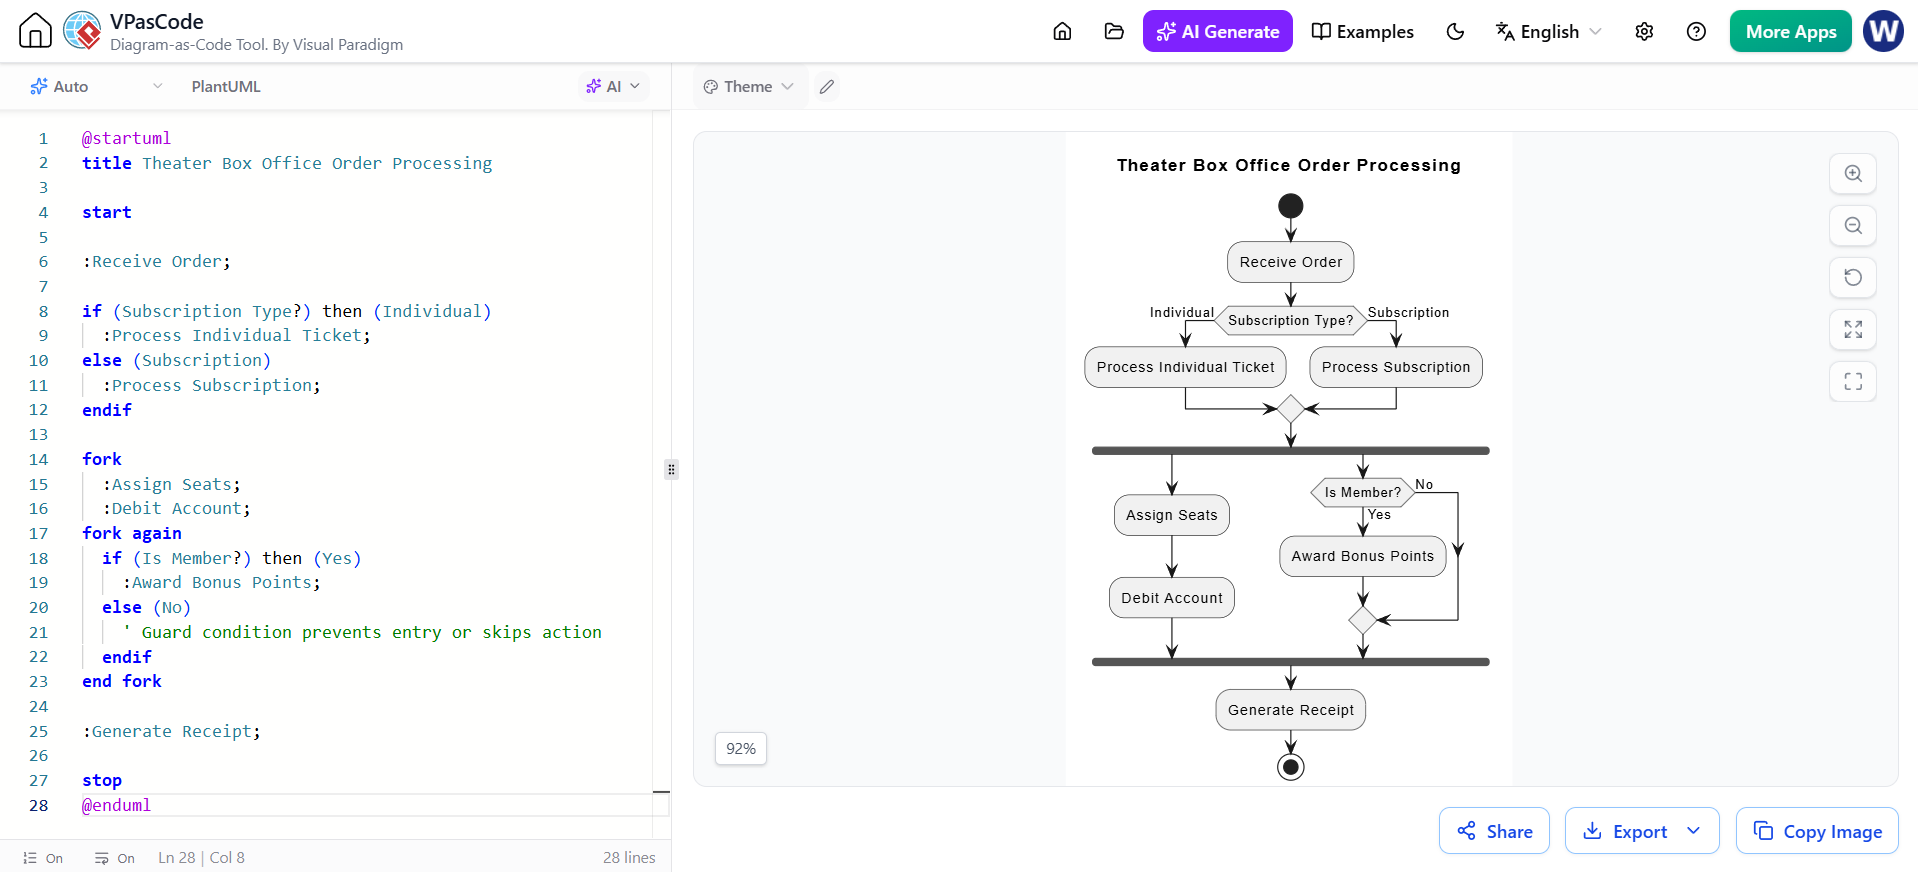
@startuml
title Theater Box Office Order Processing

start

:Receive Order;

if (Subscription Type?) then (Individual)
  :Process Individual Ticket;
else (Subscription)
  :Process Subscription;
endif

fork
  :Assign Seats;
  :Debit Account;
fork again
  if (Is Member?) then (Yes)
    :Award Bonus Points;
  else (No)
    ' Guard condition prevents entry or skips action
  endif
end fork

:Generate Receipt;

stop
@enduml
Swimlanes and Object Flow States
While control flow shows when things happen, Swimlanes show who does them, and Object Nodes show what data is being transformed.
Service Request Workflow Example
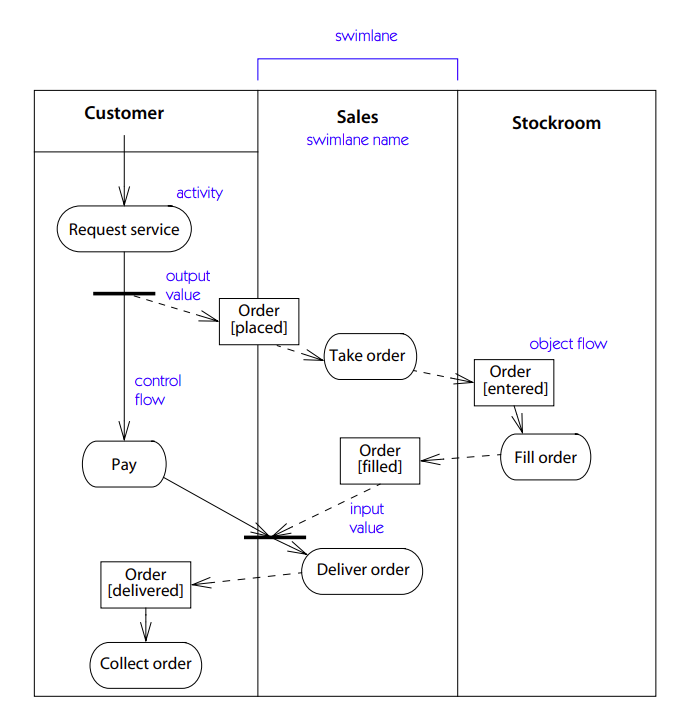
The diagram presented below showcases a division of activities into three distinct partitions using swimlanes, each corresponding to different stakeholders involved in the process. Although UML doesn’t impose a requirement that these partitions align with objects, in this example, it’s evident that certain classes align neatly with each partition. These classes would typically be responsible for executing the operations associated with each activity in the final model.
Interpreting Object Flow
This diagram incorporates object flow symbols, which depict the different states of an “order” object as it traverses a network of activities:
-
State Tracking: The
Order[placed]symbol indicates that at that point in the computation, an order has transitioned to the “placed” state within the “Request Service” activity but has not yet been consumed by the “Take Order” activity. -
Sequential Data Life: After the “Take Order” activity concludes, the order moves to the “entered” state. All object flows in this instance represent the same object at different stages of its life. As they represent the same object, they cannot coexist simultaneously.
-
Input/Output Semantics: A dashed arrow links an outgoing transition of an activity to an object flow (output), while another connects the object flow to an incoming transition (input).
PlantUML Representation: Swimlanes & Object Nodes
This code demonstrates how to define partitions and pass typed objects between actions.
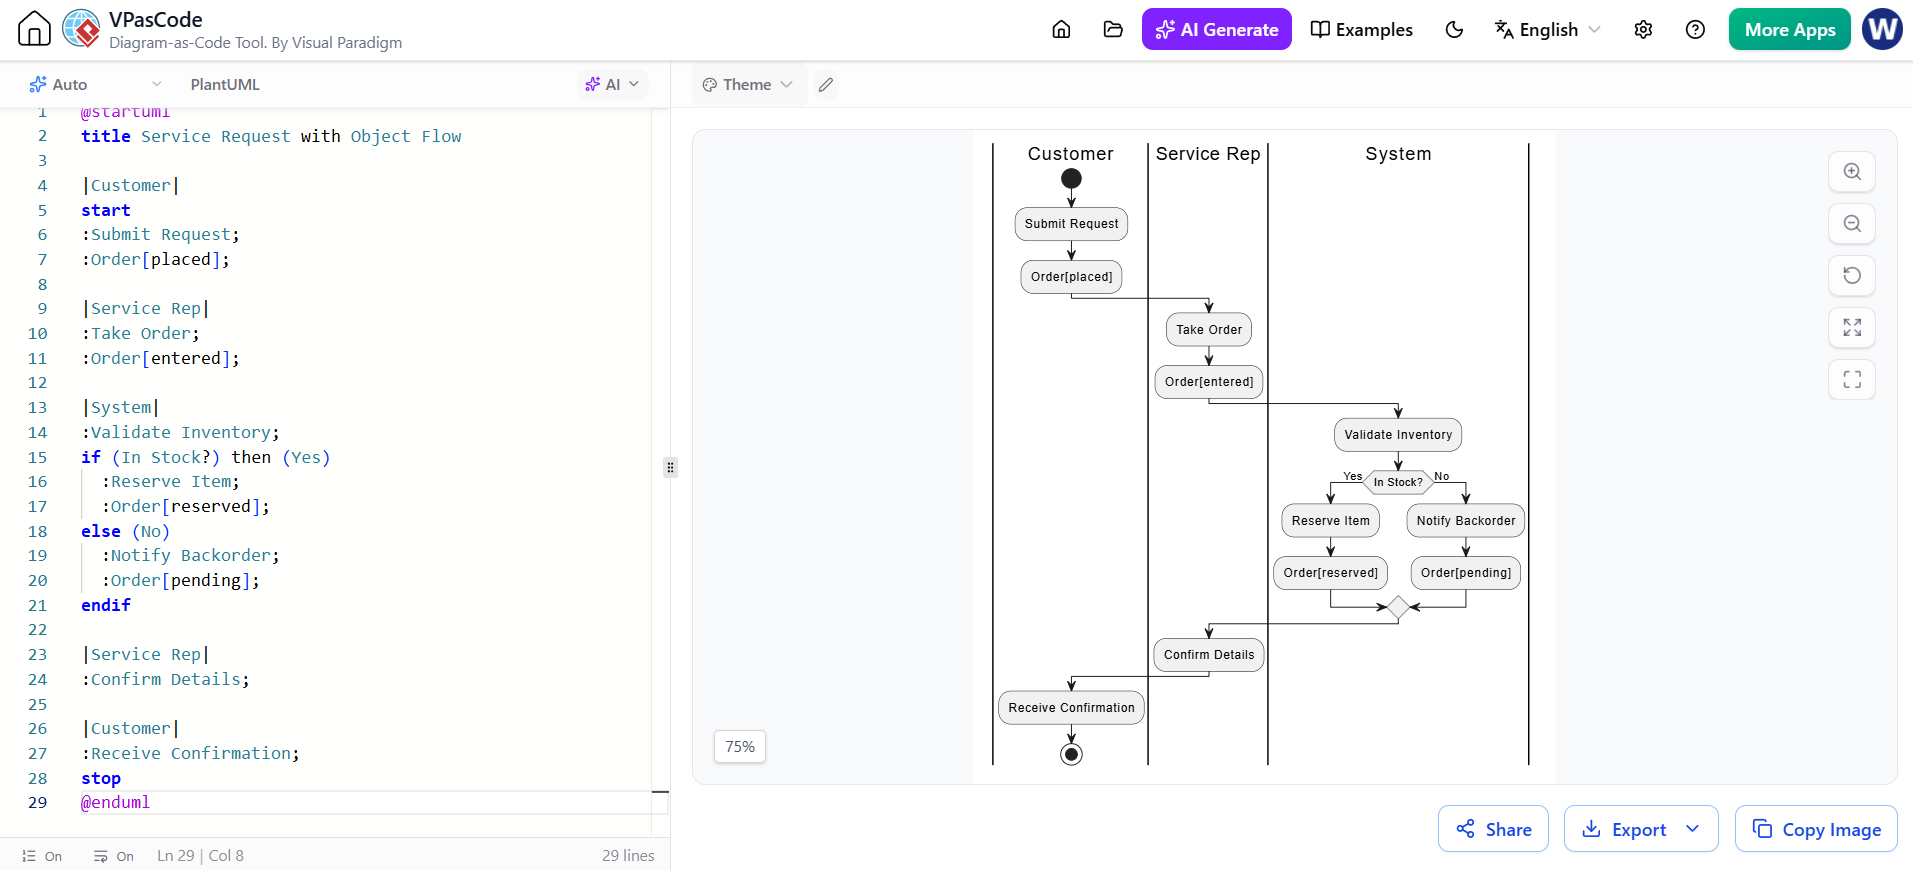
@startuml
title Service Request with Object Flow

|Customer|
start
:Submit Request;
:Order[placed];

|Service Rep|
:Take Order;
:Order[entered];

|System|
:Validate Inventory;
if (In Stock?) then (Yes)
  :Reserve Item;
  :Order[reserved];
else (No)
  :Notify Backorder;
  :Order[pending];
endif

|Service Rep|
:Confirm Details;

|Customer|
:Receive Confirmation;
stop
@enduml
Best Practices for Creating Activity Diagrams
To ensure your diagrams remain effective communication tools rather than sources of confusion, adhere to these guidelines:
-
Start Simple: Begin with the main success scenario (happy path) before adding exception handling or complex concurrency.
-
Use Swimlanes Wisely: Only use partitions when responsibility assignment adds value. Too many lanes can make the diagram unreadable.
-
Balance Forks and Joins: Every fork should ideally have a corresponding join. Unbalanced parallelism often indicates a modeling error or a missing synchronization constraint.
-
Label Guards Clearly: Decision nodes should have clear boolean expressions on outgoing edges. Avoid ambiguous labels like “Yes” without context.
-
Distinguish Control vs. Object Flow: Use solid arrows for control flow and dashed arrows (or pins) for object/data flow to avoid ambiguity.
-
Validate with Stakeholders: Walk through the diagram with the people who actually perform the process to catch edge cases and implicit knowledge.
Conclusion
Activity Diagrams in UML are indispensable for modeling the dynamic pulse of a system. By combining control flow, concurrency mechanisms, and object state tracking, they offer a rich canvas for describing everything from simple sequential algorithms to complex, multi-actor business processes.
Mastering the components—activities, decisions, forks, joins, swimlanes, and object nodes—empowers you to create precise, unambiguous models that serve as blueprints for development and documentation alike. Whether you are optimizing a theater box office workflow or designing a distributed service architecture, the principles outlined in this guide will help you leverage Activity Diagrams to their full potential.
Recommended Resources: Visual Paradigm
For further reading and tooling support, the following resources from Visual Paradigm provide in-depth coverage of UML Activity Diagrams and related modeling techniques:
- Understanding Sequence Diagrams: A Visual Blueprint of Software Interactions: Explores sequence diagrams as a complementary behavioral diagram for modeling time-ordered interactions between objects.
- Navigating the Development Seas: A Comprehensive Guide to Using Use Case, Sequence, and Activity Diagrams in IT Systems: Provides a holistic view of how activity diagrams integrate with use case and sequence diagrams throughout the SDLC.
- Visualizing Online Purchase Interactions: Mastering the AI Communication Diagram Generator in Visual Paradigm: Demonstrates modern AI-assisted approaches to generating communication and activity diagrams for e-commerce workflows.
- UML Activity Diagram Notation Guide: Symbols, Rules, and Best Practices: A definitive reference for official UML 2.x notation standards, syntax rules, and common modeling pitfalls to avoid.
Related posts:
 From Static Docs to Living Knowledge: A Case Study on Visual Paradigm OpenDocs
Mastering AI-Powered Diagram-as-Code with Mermaid, PlantUML, and Graphviz
AI-Powered TOGAF ADM: A Comprehensive Guide to Accelerating Enterprise Architecture with Visual Paradigm
Mastering Hierarchical Data Flow Diagrams: A Practical Guide to Taming Complex System Analysis
From Static Docs to Living Knowledge: A Case Study on Visual Paradigm OpenDocs
Mastering AI-Powered Diagram-as-Code with Mermaid, PlantUML, and Graphviz
AI-Powered TOGAF ADM: A Comprehensive Guide to Accelerating Enterprise Architecture with Visual Paradigm
Mastering Hierarchical Data Flow Diagrams: A Practical Guide to Taming Complex System Analysis