
A Data Flow Diagram shows how data moves through a system: where it comes from, what changes it, where it is stored, and where it goes. It deliberately ignores when things happen and how the processing is coded — which makes it the best tool for agreeing on scope and information flow with non-technical stakeholders.
1. Core Vocabulary (Your Four Symbols)
Every DFD is built from exactly four element types, plus one container.
| Element | Notation (Yourdon/DeMarco) | Purpose | Rule of Thumb |
|---|---|---|---|
| External Entity | Rectangle (box) |
Source or sink of data outside your system boundary | People, partners, other systems. Never stores data |
| Process | Circle | Transforms input data into output data | Must have both an input and an output — names are verbs |
| Data Store | Open-ended rectangle / record | Data at rest (database, file, register) | Only processes read/write it — entities never touch it |
| Data Flow | Labelled arrow | Movement of a named data packet | Every arrow needs a meaningful noun label |
| System Boundary | Dashed rounded box | Separates your system from the outside world | Everything inside is in scope for analysis |
2. The Notation Families
Before drawing, be aware that the world uses three dialects. Arrow shapes for data flows are common to all.
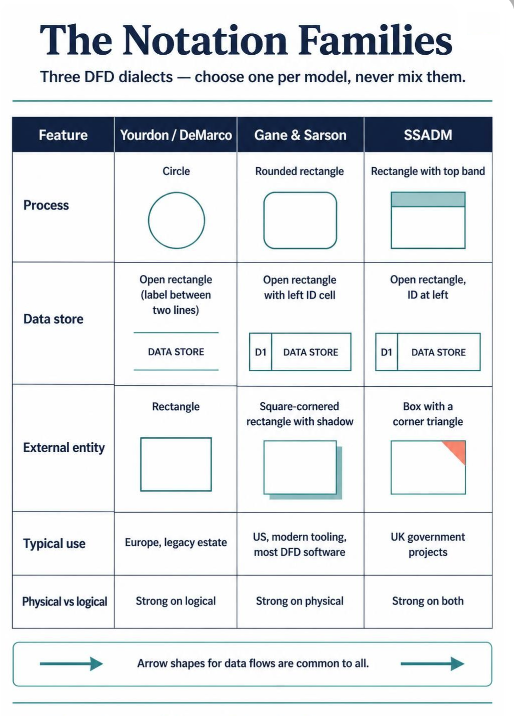
| Feature | Yourdon / DeMarco | Gane & Sarson | SSADM |
|---|---|---|---|
| Process | Circle | Rounded rectangle | Rectangle with top band |
| Data store | Open rectangle (label between two lines) | Open rectangle with left ID cell | Open rectangle, ID at left |
| External entity | Rectangle | Square-cornered rectangle with shadow | Box with a corner triangle |
| Typical use | Europe, legacy estate | US, modern tooling, most DFD software | UK government projects |
| Physical vs logical | Strong on logical | Strong on physical | Strong on both |
Pick one dialect per model and never mix them in the same diagram.
3. The Levelling Discipline
DFDs are drawn as a hierarchy, each level showing more detail. This is the single most important structural rule.
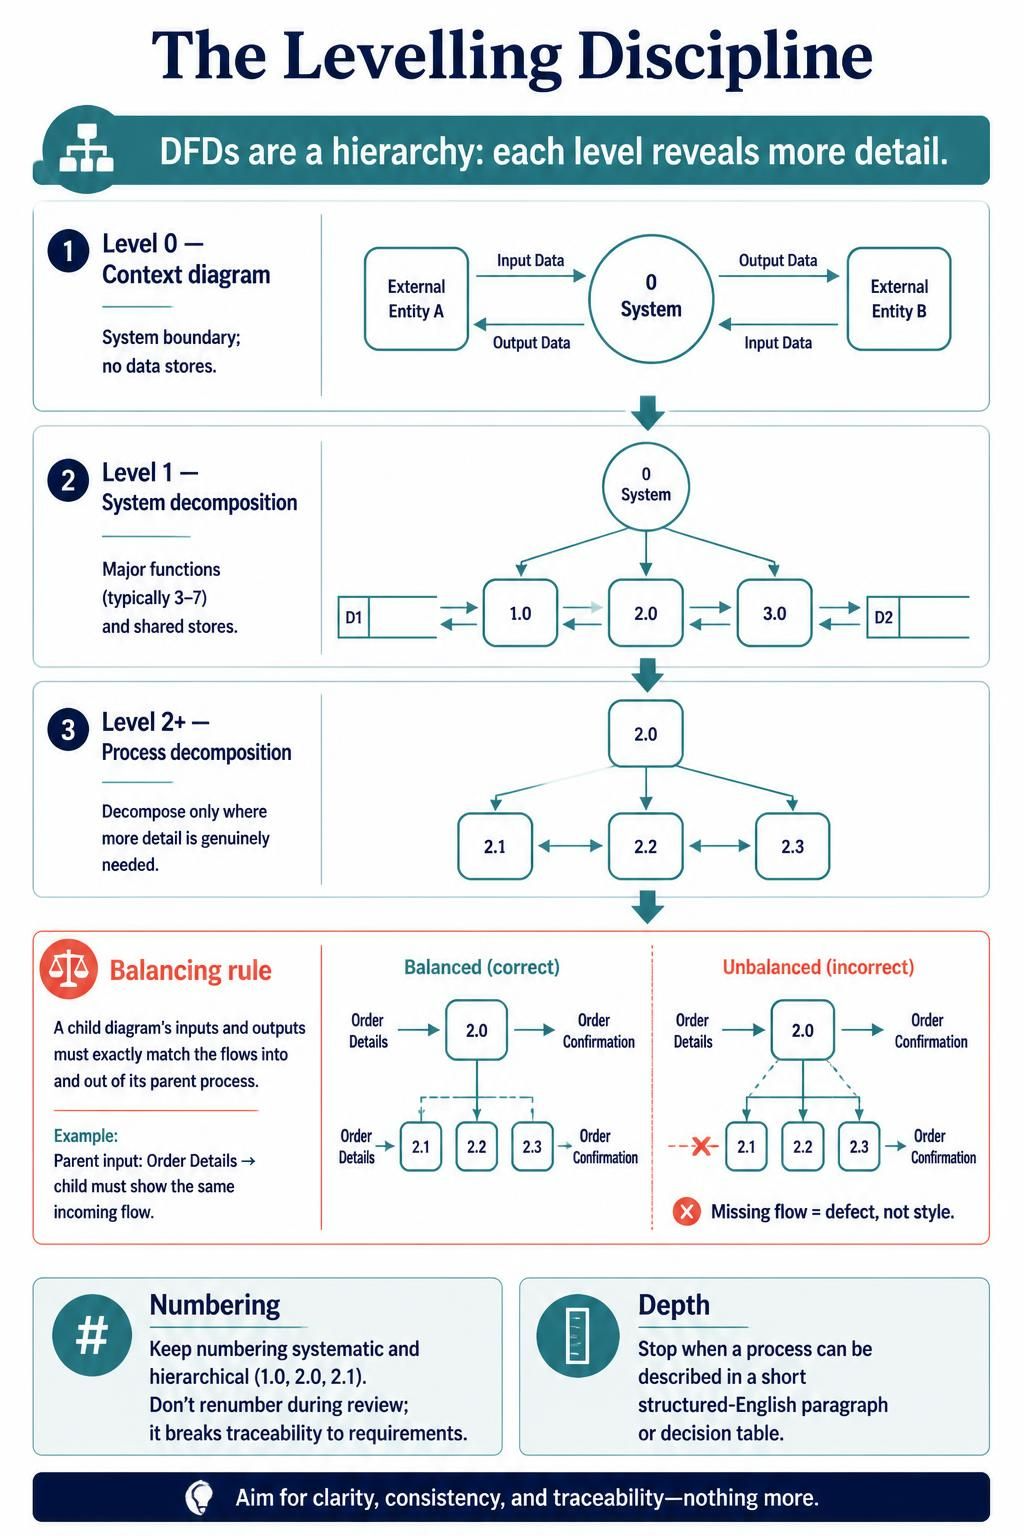
Level 0 — Context diagram. One process representing the whole system, plus every external entity and the flows between them. It answers: where is the boundary? No data stores are shown.
Level 1 — System decomposition. The single context process explodes into the major functional processes (typically 3–7), plus the data stores they share.
Level 2+ — Process decomposition. Explode one Level 1 process into sub-processes, numbered hierarchically (2.0 → 2.1, 2.2, 2.3). Draw these only for processes that genuinely need the detail.
The balancing rule. The inputs and outputs of a (sub)diagram must exactly match the flows in and out of the parent process. If the parent gets a flow marked Order Details and the child has no such incoming arrow, the model is unbalanced — a defect, not a stylistic choice.
Two further conventions worth enforcing:
- Numbering: systematic and hierarchical (
1.0,2.0,2.1). Never renumber during review — it breaks traceability against the requirements register. - Depth: stop levelling when a process is simple enough to describe in a short structured-English paragraph or decision table.
4. Notation Reference Examples
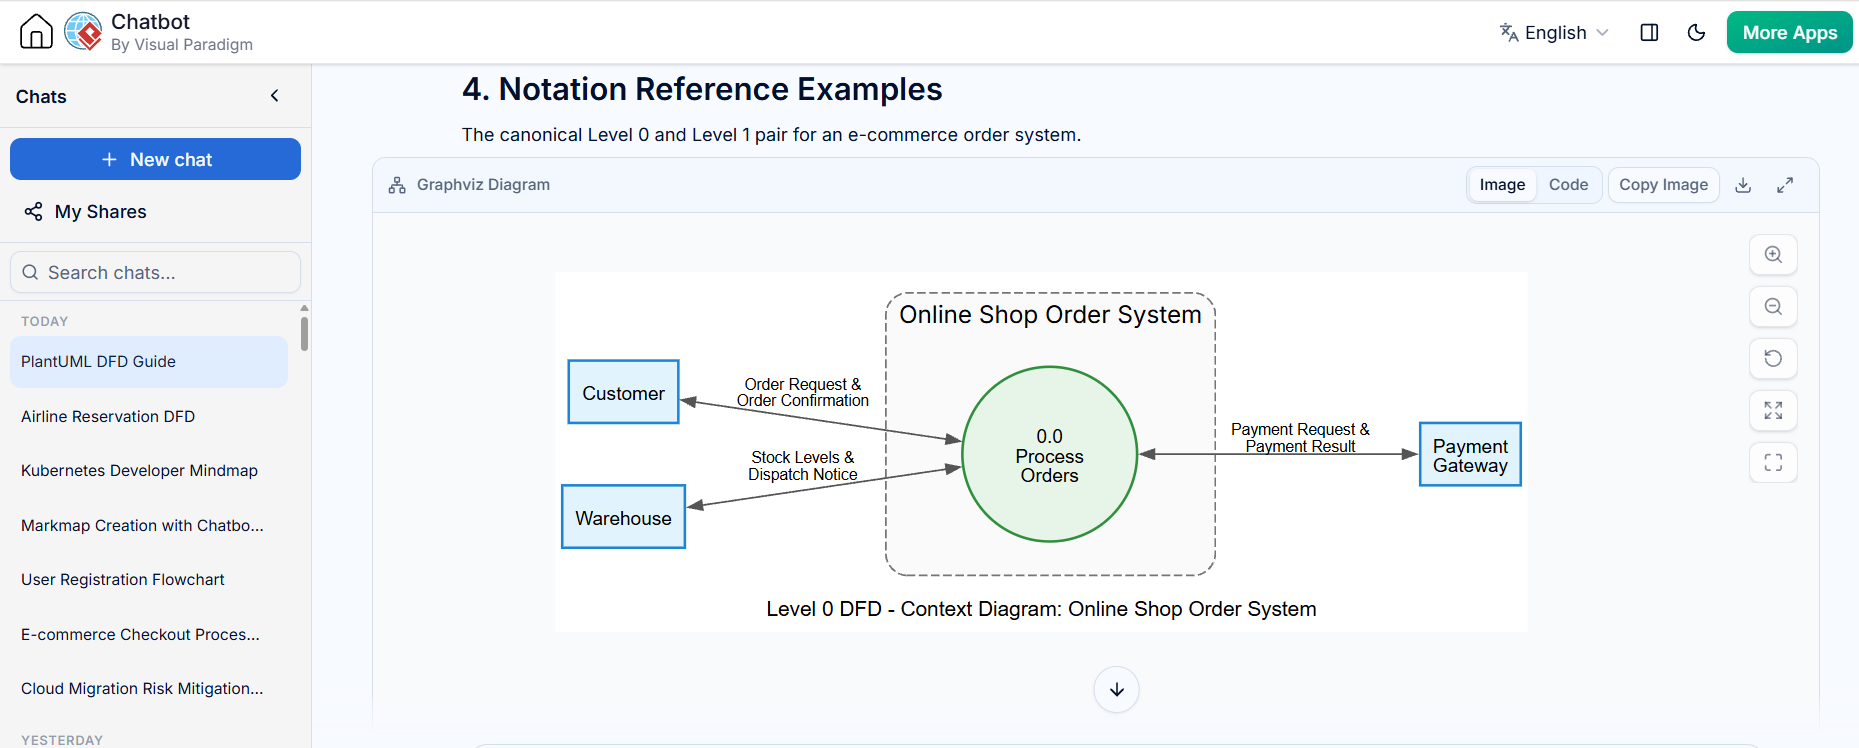
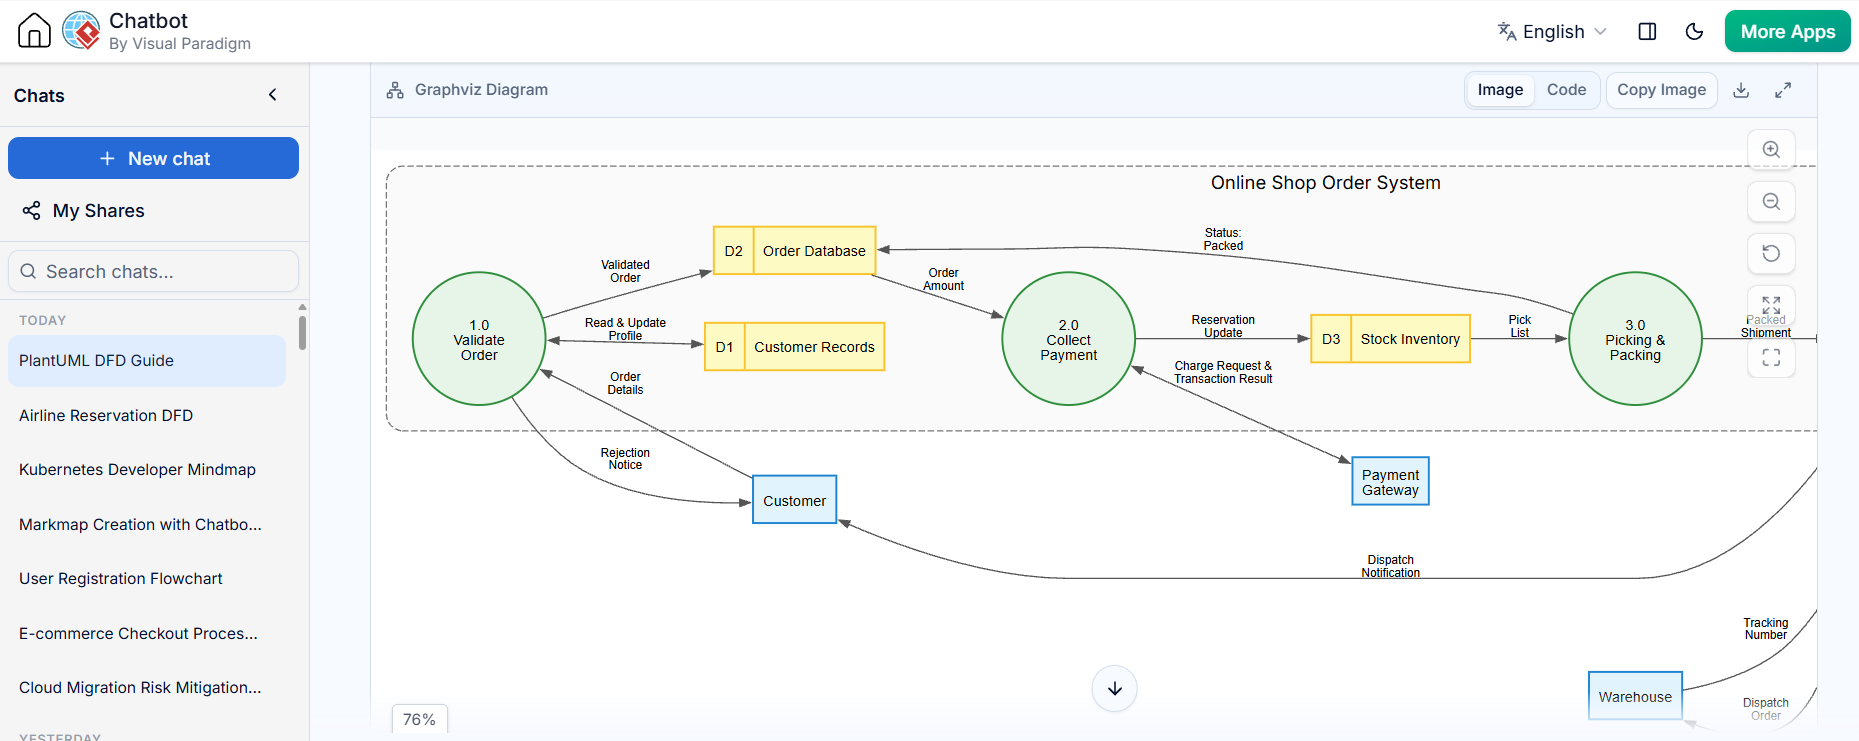
The canonical Level 0 and Level 1 pair for an e-commerce order system.
digraph DFD {
    graph [
        rankdir = LR
        splines = true
        overlap = false
        nodesep = 0.5
        ranksep = 0.8
        fontname = "Helvetica,Arial,sans-serif"
        fontsize = 12
        label = "Level 0 DFD - Context Diagram: Online Shop Order System"
    ]

    node [
        fontname = "Helvetica,Arial,sans-serif"
        fontsize = 11
        penwidth = 1.5
    ]

    node [shape = box, style = "filled", fillcolor = "#E1F5FE", color = "#0288D1"]
    Customer [label="Customer"];
    PaymentGateway [label="Payment\nGateway"];
    Warehouse [label="Warehouse"];

    subgraph cluster_SystemBoundary {
        label = "Online Shop Order System";
        fontname = "Helvetica,Arial,sans-serif; bold"
        fontsize = 14
        color = "#757575"
        style = "dashed,rounded"
        bgcolor = "#FAFAFA"
        margin = 20

        node [shape = circle, style = "filled", fillcolor = "#E8F5E9", color = "#388E3C", fixedsize = true, width = 1.4]
        P0 [label="0.0\nProcess\nOrders"];
    }

    edge [
        fontname = "Helvetica,Arial,sans-serif"
        fontsize = 9
        color = "#555555"
        arrowsize = 0.8
    ]

    Customer -> P0 [label="Order Request &\nOrder Confirmation", dir=both];
    P0 -> PaymentGateway [label="Payment Request &\nPayment Result", dir=both];
    Warehouse -> P0 [label="Stock Levels &\nDispatch Notice", dir=both];
}
digraph DFDLevel1 {
    graph [
        rankdir = LR
        splines = true
        overlap = false
        nodesep = 0.5
        ranksep = 0.8
        fontname = "Helvetica,Arial,sans-serif"
        fontsize = 12
        label = "Level 1 DFD - Online Shop Order System"
    ]

    node [
        fontname = "Helvetica,Arial,sans-serif"
        fontsize = 11
        penwidth = 1.5
    ]

    node [shape = box, style = "filled", fillcolor = "#E1F5FE", color = "#0288D1"]
    Customer [label="Customer"];
    PaymentGateway [label="Payment\nGateway"];
    Warehouse [label="Warehouse"];

    subgraph cluster_SystemBoundary {
        label = "Online Shop Order System";
        fontname = "Helvetica,Arial,sans-serif; bold"
        fontsize = 14
        color = "#757575"
        style = "dashed,rounded"
        bgcolor = "#FAFAFA"
        margin = 20

        node [shape = circle, style = "filled", fillcolor = "#E8F5E9", color = "#388E3C", fixedsize = true, width = 1.4]
        P1 [label="1.0\nValidate\nOrder"];
        P2 [label="2.0\nCollect\nPayment"];
        P3 [label="3.0\nPicking &\nPacking"];
        P4 [label="4.0\nDispatch &\nNotify"];

        node [shape = record, style = "filled", fillcolor = "#FFF9C4", color = "#FBC02D", fixedsize = false]
        CustomerDS [label="{ <id> D1 | Customer Records }"];
        OrderDS [label="{ <id> D2 | Order Database }"];
        StockDS [label="{ <id> D3 | Stock Inventory }"];
        ShipDS [label="{ <id> D4 | Shipment Log }"];
    }

    edge [
        fontname = "Helvetica,Arial,sans-serif"
        fontsize = 9
        color = "#555555"
        arrowsize = 0.8
    ]

    Customer -> P1 [label="Order\nDetails"];
    P1 -> Customer [label="Rejection\nNotice"];
    P1 -> CustomerDS [label="Read & Update\nProfile", dir=both];
    P1 -> OrderDS [label="Validated\nOrder"];

    P2 -> PaymentGateway [label="Charge Request &\nTransaction Result", dir=both];
    OrderDS -> P2 [label="Order\nAmount"];
    P2 -> StockDS [label="Reservation\nUpdate"];

    StockDS -> P3 [label="Pick\nList"];
    P3 -> OrderDS [label="Status:\nPacked"];

    P3 -> P4 [label="Packed\nShipment"];
    P4 -> Warehouse [label="Dispatch\nOrder"];
    Warehouse -> P4 [label="Tracking\nNumber"];
    P4 -> ShipDS [label="Shipment\nRecord"];
    P4 -> Customer [label="Dispatch\nNotification"];
}
Note the standard grading colours used above: blue = external entity, green = process, yellow = data store, grey dashed = system boundary.
5. A Complex Example — Decomposition Pattern
For a system with genuine depth, the hierarchy typically looks like this tree. Processes only appear at one level; stores may be shared across levels.
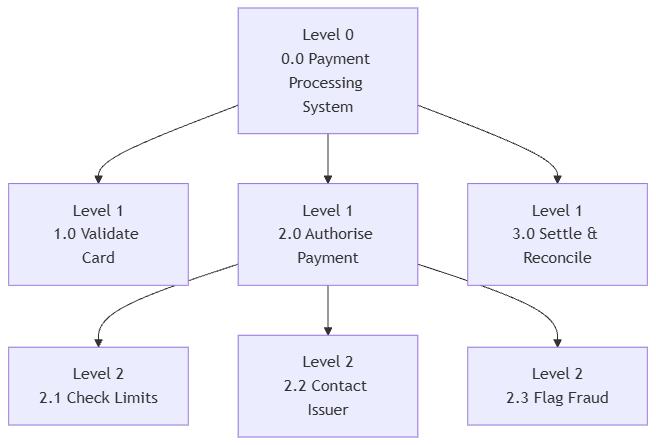
flowchart TB
    L0["Level 0<br/>0.0 Payment Processing System"]
    L1a["Level 1<br/>1.0 Validate Card"]
    L1b["Level 1<br/>2.0 Authorise Payment"]
    L1c["Level 1<br/>3.0 Settle & Reconcile"]
    L2a["Level 2<br/>2.1 Check Limits"]
    L2b["Level 2<br/>2.2 Contact Issuer"]
    L2c["Level 2<br/>2.3 Flag Fraud"]

    L0 --> L1a
    L0 --> L1b
    L0 --> L1c
    L1b --> L2a
    L1b --> L2b
L1b --> L2cEvery leaf box is a Level 2 diagram; the parent flow Authorisation Request appears as an input on the Level 2 diagram for 2.0.
6. Common Modelling Mistakes
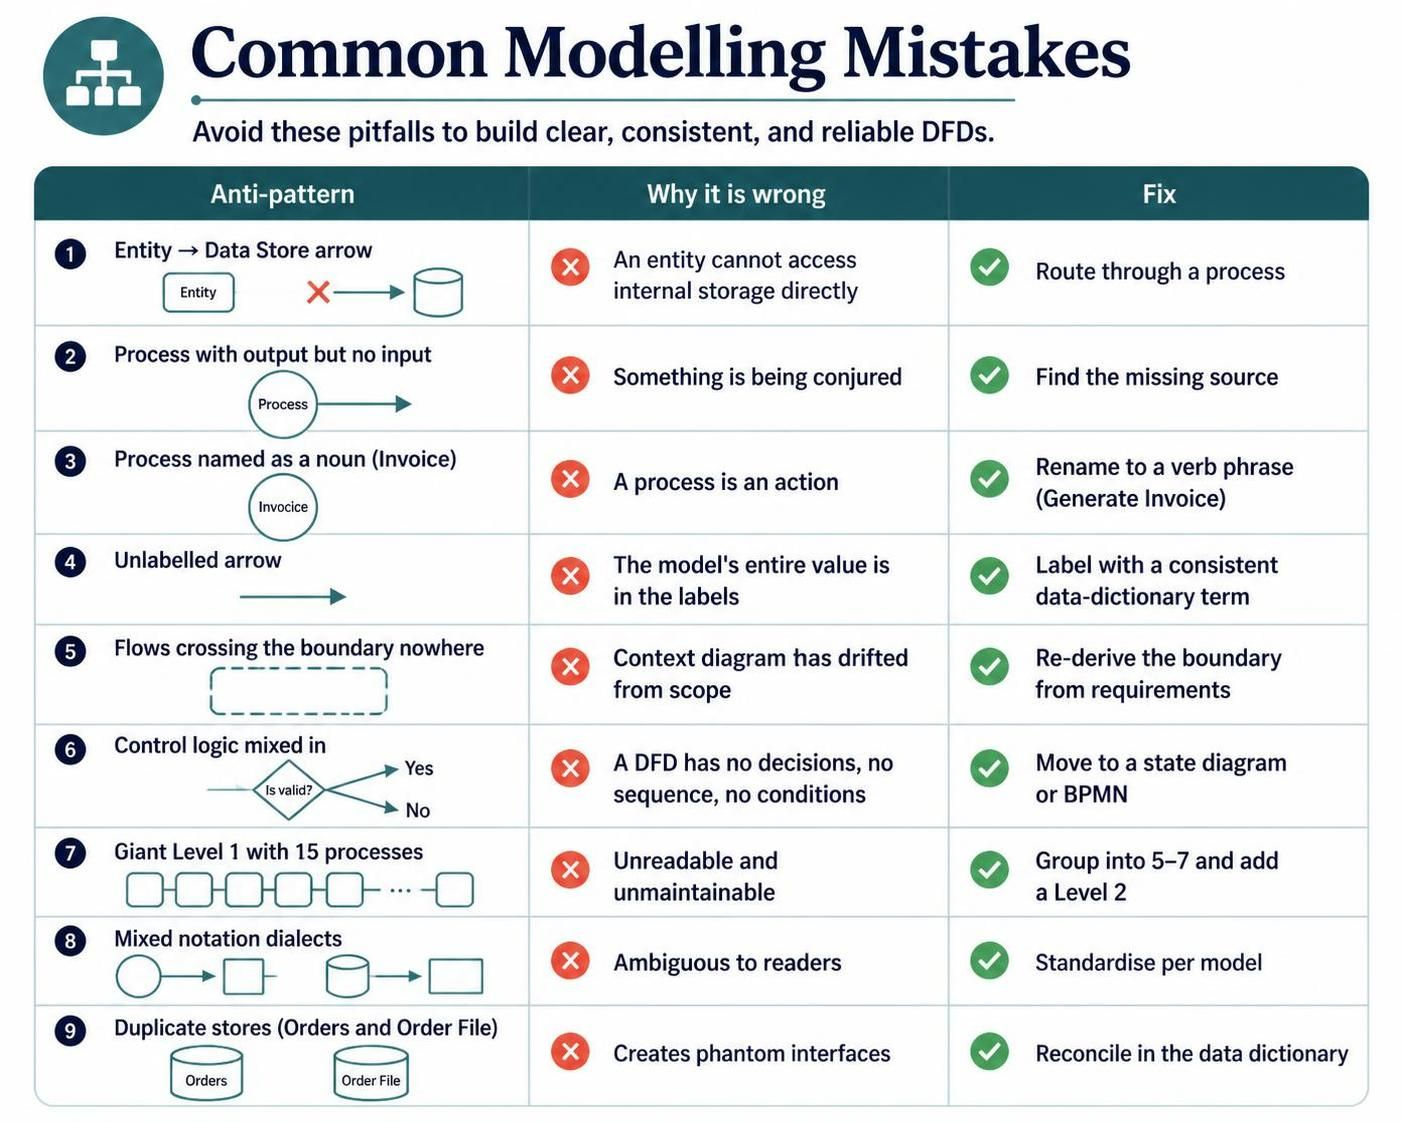
| Anti-pattern | Why it is wrong | Fix |
|---|---|---|
| Entity → Data Store arrow | An entity cannot access internal storage directly | Route through a process |
| Process with output but no input | Something is being conjured | Find the missing source |
Process named as a noun (Invoice) |
A process is an action | Rename to a verb phrase (Generate Invoice) |
| Unlabelled arrow | The model’s entire value is in the labels | Label with a consistent data-dictionary term |
| Flows crossing the boundary nowhere | Context diagram has drifted from scope | Re-derive the boundary from requirements |
| Control logic mixed in | A DFD has no decisions, no sequence, no conditions | Move to a state diagram or BPMN |
| Giant Level 1 with 15 processes | Unreadable and unmaintainable | Group into 5–7 and add a Level 2 |
| Mixed notation dialects | Ambiguous to readers | Standardise per model |
Duplicate stores (Orders and Order File) |
Creates phantom interfaces | Reconcile in the data dictionary |
7. Where DFDs Earn Their Keep
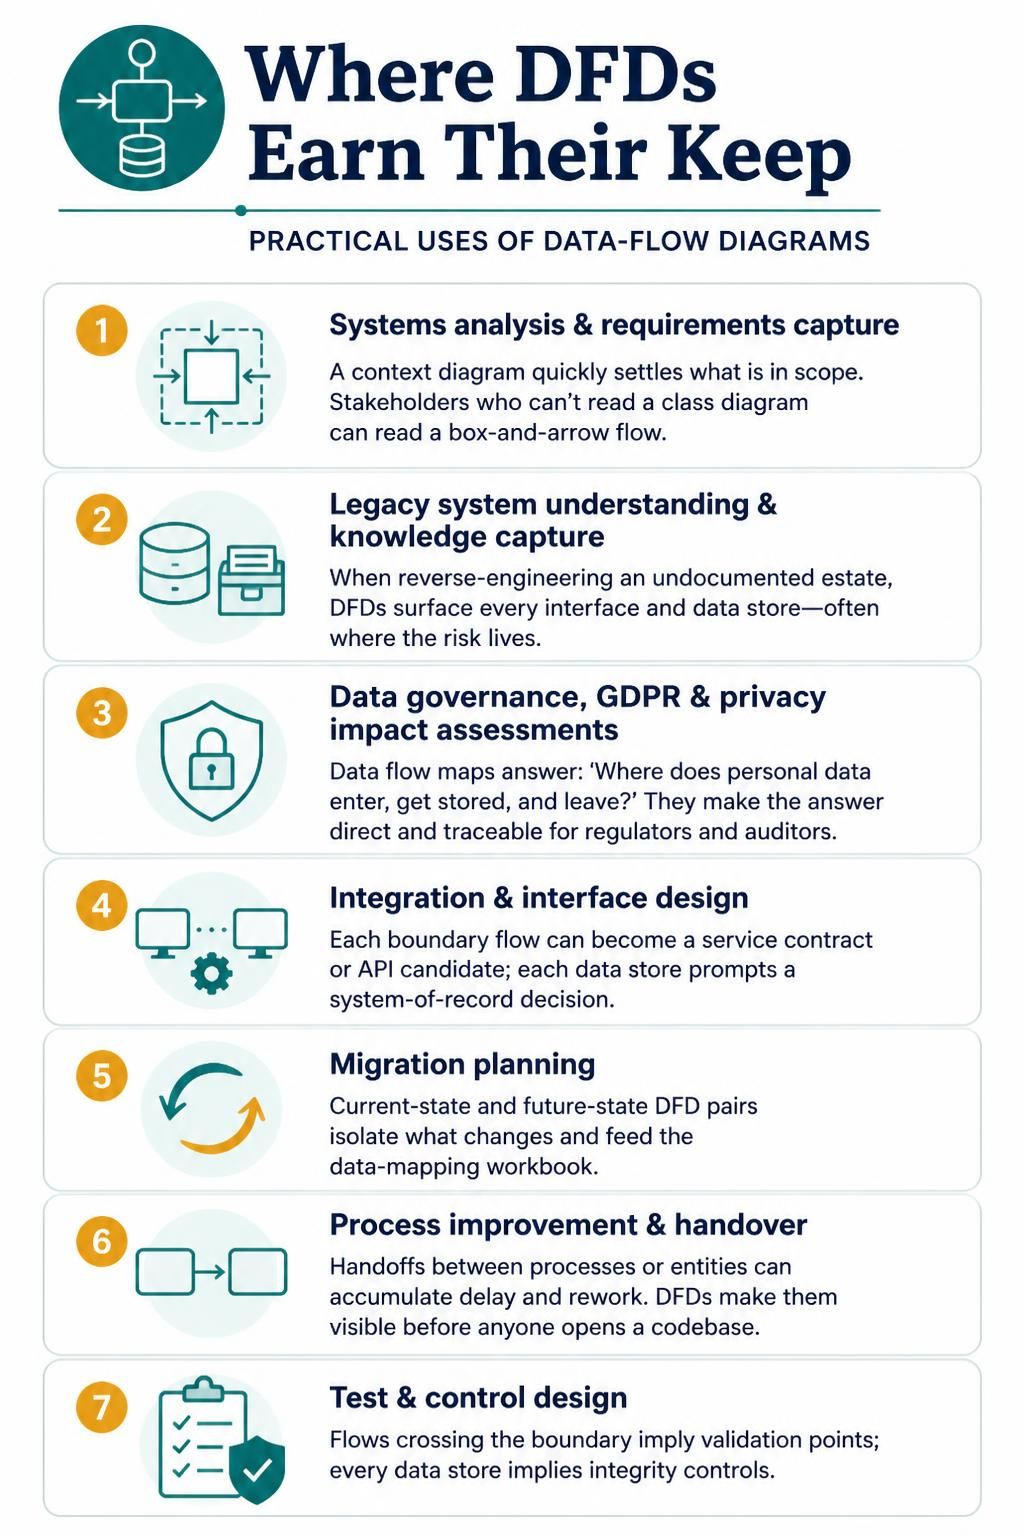
Systems analysis and requirements capture. The context diagram is the fastest way to settle an argument about what is in scope. Stakeholders who cannot read a class diagram can read a box-and-arrow flow.
Legacy system understanding and knowledge capture. Reverse-engineering an undocumented estate: DFDs surface every interface and every data store, which is often where the risk lives.
Data governance, GDPR, and privacy impact assessments. Data flow maps are the artefact regulators and auditors ask for — “where does personal data enter, get stored, and leave?” A DFD answers this directly and traceably.
Integration and interface design. Each boundary flow becomes a service contract or API candidate; each data store becomes a system of record decision.
Migration planning. Current-state and future-state DFD pairs isolate exactly what changes, which feeds the data-mapping workbook.
Process improvement and handover. Where a handoff crosses a process or an entity, delays and rework accumulate. DFDs make handoffs visible before anyone opens a codebase.
Test and control design. Flows that cross the boundary imply validation points; every data store implies integrity controls.
8. Benefits and Limits
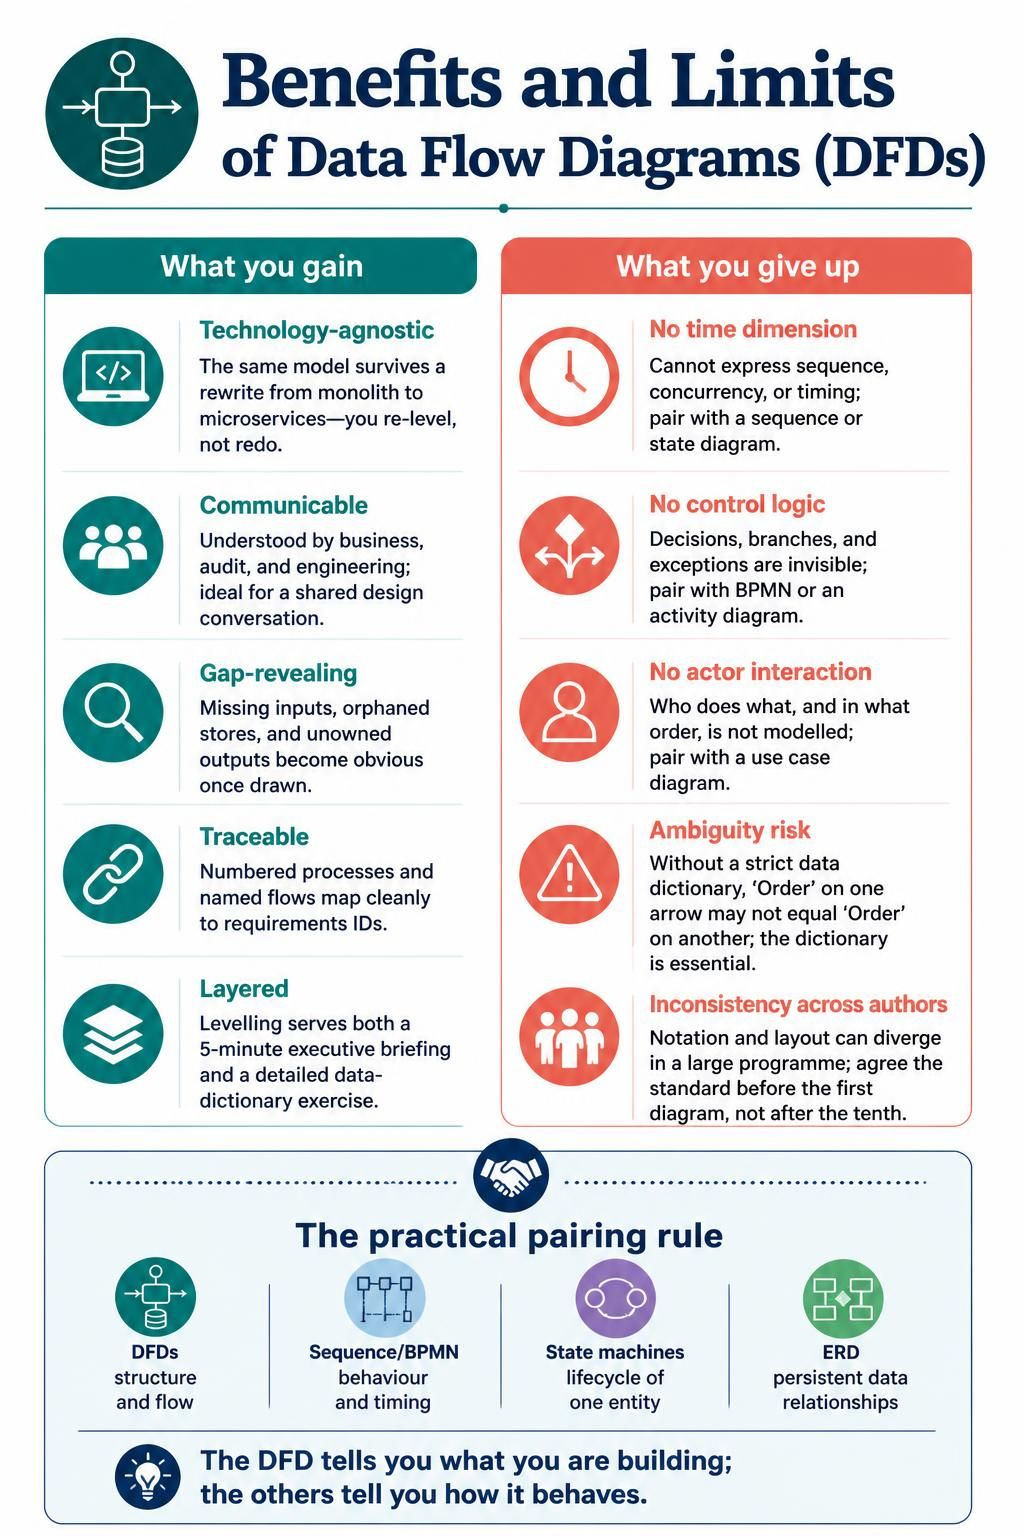
What you gain
-
Technology-agnostic. The same model survives a rewrite from monolith to microservices — you re-level, you do not redo.
- Communicable. Understood by business, audit, and engineering simultaneously; ideal for a shared design conversation.
- Gap-revealing. Missing inputs, orphaned stores, and unowned outputs become obvious once drawn.
- Traceable. Numbered processes and named flows map cleanly onto requirements IDs.
- Layered. Levelling lets one model serve a 5-minute executive briefing and a detailed data-dictionary exercise.
What you give up
- No time dimension. DFDs cannot express sequence, concurrency, or timing — pair with a sequence or state diagram.
-
No control logic. Decisions, branches, and exceptions are invisible — pair with BPMN or an activity diagram.
- No actors’ interaction. Who does what, and in what order, is not modelled — pair with a use case diagram.
- Ambiguity risk. Without a strict data dictionary, “Order” on one arrow may not equal “Order” on another; the dictionary is not optional.
-
Inconsistency across authors. Notation families and layout conventions diverge quickly in a large programme — agree the standard before the first diagram, not after the tenth.
The practical pairing rule: DFDs for structure and flow, sequence/BPMN for behaviour and timing, state machines for lifecycle of a single entity, and an ERD for persistent data relationships. The DFD tells you what you are building; the others tell you how it behaves.
