Database schemas often evolve organically rather than through intentional design. Over time, rapid development cycles, lack of documentation, and changing business requirements lead to complex, difficult-to-navigate structures. Many organizations find themselves inheriting legacy systems where the original architects are no longer available, and the data model is obscured by years of patches and hotfixes. This process involves analyzing the existing data layers and reconstructing them into a standardized Entity Relationship Diagram (ERD). The goal is clarity, maintainability, and integrity.
Reverse engineering a database is not merely about drawing lines between tables; it is about understanding the business logic embedded within the data. A clean ERD serves as a blueprint for future development, a communication tool for stakeholders, and a safeguard against data corruption. This guide details the technical workflow for transforming a chaotic schema into a structured, normalized design without relying on specific proprietary tools.
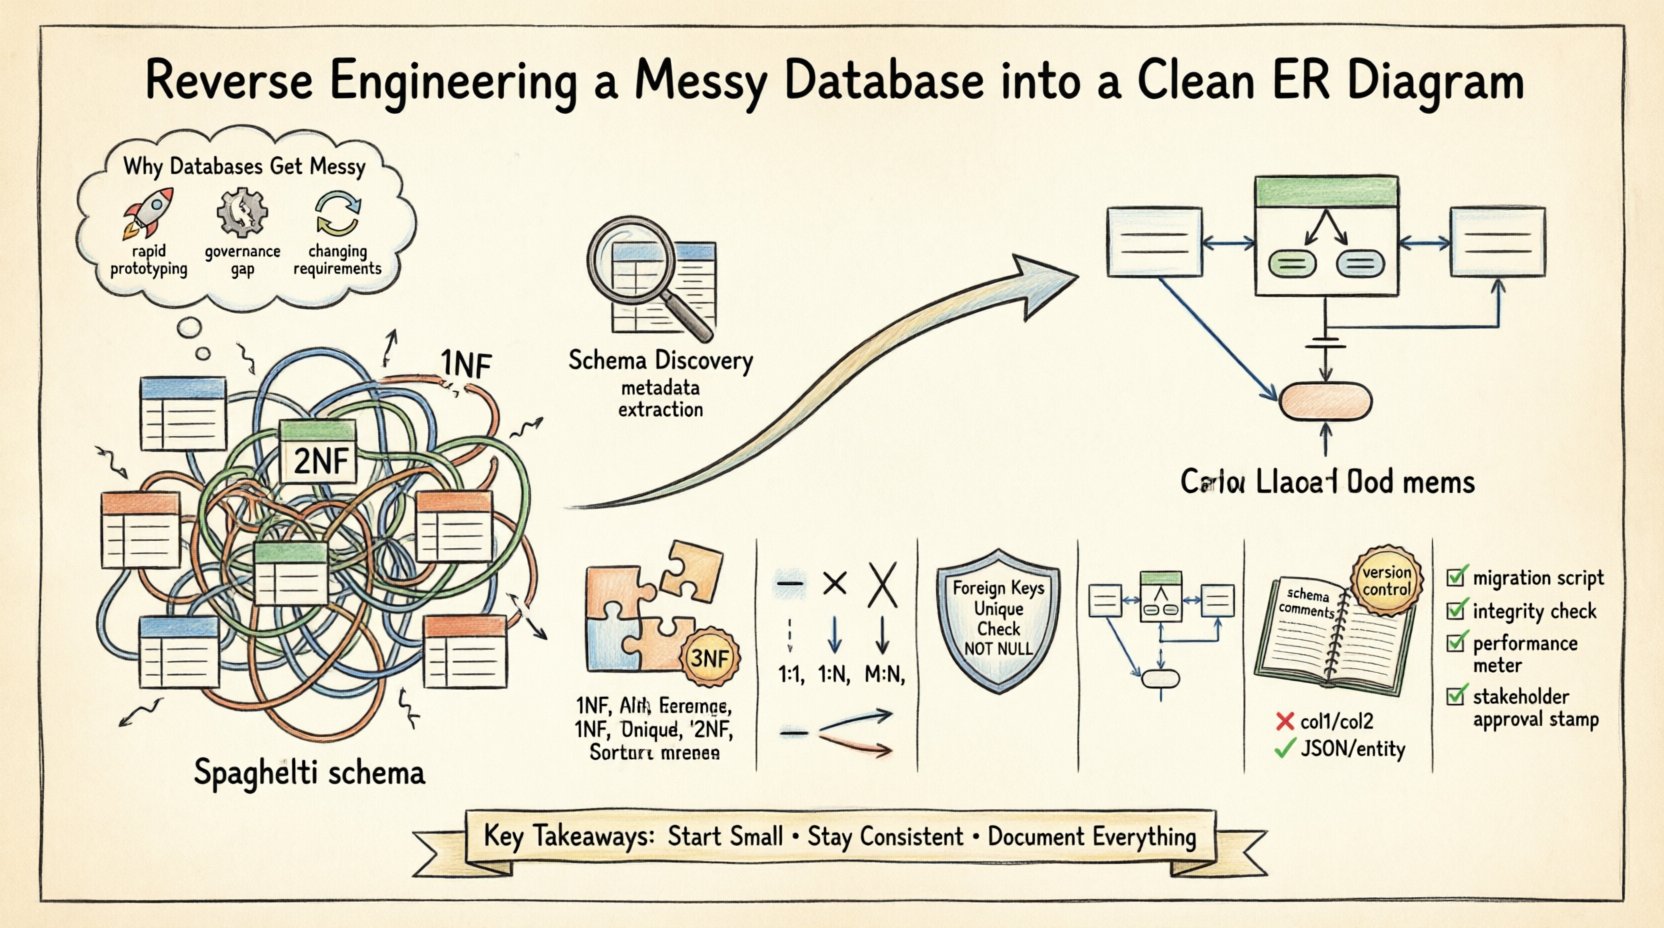
Why Databases Get Messy 📉
Understanding the root cause of schema debt is the first step toward remediation. Several factors contribute to a disorganized database structure:
- Rapid Prototyping: Initial development often prioritizes speed over structure. Tables are created ad-hoc to satisfy immediate feature requests without considering long-term scalability.
- Lack of Governance: When multiple developers modify the schema without a centralized review process, naming conventions diverge, and redundant columns appear.
- Business Logic Changes: As requirements shift, tables are altered to accommodate new fields. Foreign keys are sometimes dropped to bypass constraints, leading to orphaned records.
- Documentation Gaps: Comments and metadata descriptions are often omitted during initial deployment, making it difficult to understand the intent of specific columns later.
These issues result in what is often called “spaghetti schema.” Relationships become implicit rather than explicit, and primary keys may be lost or duplicated across multiple tables. The following sections outline the systematic approach to resolving these issues.
Phase 1: Schema Discovery and Profiling 🔍
Before drawing any lines, you must understand the current state of the database. This phase focuses on extraction and analysis rather than modification.
Extracting Metadata
Every relational database management system maintains system catalogs or information schema views. These repositories contain details about tables, columns, data types, constraints, and indexes. Utilize query interfaces to retrieve this metadata.
- Table List: Retrieve all table names and their creation dates to identify legacy structures.
- Column Definitions: Extract column names, data types, nullability, and default values.
- Constraints: Identify primary keys, unique constraints, and foreign key relationships. Note that some relationships may be enforced only at the application level, not in the database.
- Indexes: Analyze existing indexes to understand query performance patterns and identify potential candidate keys.
Data Profiling
Metadata tells you what the schema *should* be, but data profiling tells you what it *is*. Scanning actual data values reveals inconsistencies that schema definitions miss.
- Value Distribution: Check for high cardinality or low cardinality columns that might indicate a need for normalization.
- Null Rates: High rates of nulls in required fields suggest missing constraints or poor data entry practices.
- Data Quality: Identify formatting inconsistencies, such as phone numbers stored as text with varying formats.
Phase 2: Entity Identification and Normalization 🧱
Once the raw data is understood, the next step is logical restructuring. This involves identifying entities and applying normalization rules to reduce redundancy.
Identifying Entities
An entity represents a distinct object or concept within the business domain. In a messy database, entities are often scattered across multiple tables or combined incorrectly.
- Granularity: Ensure each table represents a single concept. If a table holds both customer information and order information, it likely violates normalization principles.
- Primary Keys: Establish a unique identifier for each entity. Avoid using natural keys (like email addresses) if they are subject to change; use surrogate keys instead.
- Naming Conventions: Standardize table names to a consistent format, such as singular nouns (e.g.,
customerinstead ofcustomers).
Applying Normalization
Normalization is the process of organizing data to reduce redundancy and improve integrity. While the goal is not always to reach the theoretical maximum (Boyce-Codd Normal Form), aiming for Third Normal Form (3NF) is a robust standard for transactional systems.
| Form | Definition | Goal |
|---|---|---|
| First Normal Form (1NF) | Atomic values in columns; no repeating groups. | Ensure each cell contains a single value. |
| Second Normal Form (2NF) | Meets 1NF and removes partial dependencies. | Ensure non-key attributes depend on the whole primary key. |
| Third Normal Form (3NF) | Meets 2NF and removes transitive dependencies. | Ensure non-key attributes depend only on the primary key. |
When reverse engineering, look for columns that store lists of values (e.g., a comma-separated string of tags). These must be split into separate rows in a junction table to satisfy 1NF. Similarly, attributes that describe different entities (e.g., product_name and vendor_address in the same table) should be separated into distinct entities to satisfy 2NF and 3NF.
Phase 3: Mapping Relationships 🔗
Relationships define how entities interact. In a messy database, these are often implicit or missing. This phase involves defining the cardinality and optionality of these connections.
Cardinality Types
- One-to-One (1:1): One record in Table A relates to exactly one record in Table B. This is rare and often indicates a split for security or performance reasons.
- One-to-Many (1:N): One record in Table A relates to multiple records in Table B. This is the most common relationship (e.g., One Customer places Many Orders).
- Many-to-Many (M:N): Multiple records in Table A relate to multiple records in Table B. This requires an intermediate junction table (e.g., Students and Courses).
Resolving Many-to-Many Relationships
Messy databases often attempt to handle many-to-many relationships by duplicating data or creating wide tables with multiple foreign key columns. The correct approach is to introduce a bridge table.
- Identify the two parent entities.
- Create a new table containing the primary keys of both parents.
- Add any specific attributes related to the relationship itself (e.g.,
enrollment_datein a Student-Course bridge table).
Phase 4: Constraints and Data Integrity 🔒
A diagram is useless if it does not enforce the rules it depicts. Physical implementation must reflect the logical design through constraints.
- Foreign Keys: Explicitly define foreign key constraints to prevent orphaned records. This ensures referential integrity automatically.
- Unique Constraints: Apply unique constraints to columns that must be distinct (e.g., email addresses, usernames).
- Check Constraints: Use check constraints to validate data formats or ranges (e.g.,
age >= 0). - Not Null: Mark essential fields as
NOT NULLto ensure data completeness.
Phase 5: Visualizing the ERD 🎨
Once the logical model is established, it must be visualized. While specific software exists for this, the principles of diagramming remain consistent.
Diagramming Standards
Choose a notation standard to ensure the diagram is readable by different stakeholders.
- Crow’s Foot Notation: Widely used in industry. Uses specific symbols to indicate cardinality (e.g., a single line for “one”, a crow’s foot for “many”).
- UML Class Diagrams: Uses boxes and arrows, often preferred by software developers familiar with object-oriented design.
- Chen Notation: Uses diamonds for relationships, common in academic settings but less frequent in modern enterprise tools.
Layout Best Practices
- Grouping: Group related tables together (e.g., all Order tables in one area) to show logical domains.
- Flow Direction: Arrange diagrams to flow logically from left to right or top to bottom.
- Readability: Ensure table names are clearly visible and line crossings are minimized.
Phase 6: Documentation and Maintenance 📝
A static diagram is a snapshot. To ensure long-term value, the documentation must be maintained alongside the code.
Schema Comments
Use column and table comments to explain business logic. For example, a column named status should have a comment explaining what values are valid (e.g., “0: Pending, 1: Approved, 2: Rejected”).
Version Control
Store the ERD and schema definition files in a version control system. This allows you to track changes over time and revert if necessary.
Common Anti-Patterns to Avoid 🚫
During the cleanup process, be vigilant against common pitfalls.
| Anti-Pattern | Issue | Solution |
|---|---|---|
| Generic Data Columns | Using columns like col1, col2 for flexible storage. |
Replace with a JSON column or a new entity table. |
| Composite Keys | Using multiple columns as a primary key. | Prefer surrogate keys (auto-increment integers) for simplicity. |
| Denormalization for Speed | Duplicating data to avoid joins. | Accept the performance cost of joins unless profiling proves otherwise. |
Phase 7: Validation and Testing ✅
After restructuring, the new schema must be validated against the existing data.
- Migration Scripts: Write scripts to move data from the old schema to the new one. Ensure no data is lost during the transfer.
- Referential Integrity Checks: Run queries to ensure all foreign keys point to valid parent records.
- Performance Testing: Run the application against the new schema to verify that query performance remains acceptable.
- Stakeholder Review: Present the diagram to business users to confirm it accurately reflects their processes.
Final Considerations 🏁
Reverse engineering a database is a significant undertaking that requires patience and precision. It is not a one-time task but part of a continuous cycle of data governance. By following a structured approach, organizations can transform chaotic data repositories into reliable assets.
Remember that the diagram is a communication tool. If the business stakeholders cannot understand the relationships depicted, the technical effort has not fully succeeded. Regular reviews of the schema ensure that future development aligns with the established architecture.
Focus on consistency. Whether it is naming conventions, constraint definitions, or diagram styles, uniformity reduces cognitive load for everyone interacting with the system. Start small. Pick one module or domain, clean it up, and document it thoroughly. Then expand the process to other areas. This incremental approach mitigates risk and allows for continuous improvement.
Ultimately, a clean ERD structure is the foundation of a robust data strategy. It empowers developers to build features faster and reduces the likelihood of data loss or corruption. Invest the time now to reap the benefits of stability and clarity later.

