


Data forms the backbone of every digital system, from simple web applications to complex enterprise resource planning platforms. Without a structured approach to organizing this information, systems become fragile, slow, and difficult to maintain. This is where the Entity-Relationship Diagram, commonly known as the ERD, becomes essential. It serves as the foundational map for database design, translating abstract business requirements into a concrete technical structure.
This guide explores the mechanics of ER modeling, the rules governing data integrity, and the strategies required to build scalable architectures. By understanding the core principles of entities, relationships, and normalization, architects can ensure their data layers remain robust and efficient over time.
🔍 What is an Entity-Relationship Diagram?
An Entity-Relationship Diagram is a visual representation of data structures and the relationships between them. It is a conceptual tool used during the design phase of database development. Rather than focusing on the physical storage mechanisms, such as disk blocks or memory addresses, the ERD focuses on the logical organization of data.
Think of it as an architectural blueprint for a house. Before pouring concrete or laying bricks, an architect draws a plan showing where walls go, where doors connect rooms, and how utilities flow. Similarly, an ERD shows where data lives, how it connects, and how it flows through the application.
Key Purposes of ER Modeling
- Communication: It bridges the gap between technical teams and business stakeholders. Visual diagrams are easier to understand than raw code or SQL scripts.
- Planning: It identifies potential issues before implementation begins. Design flaws are cheaper to fix on paper than in production.
- Documentation: It serves as a reference for future developers, explaining how data is structured and related.
- Optimization: It highlights redundancy and inefficiencies that could lead to slower query performance.
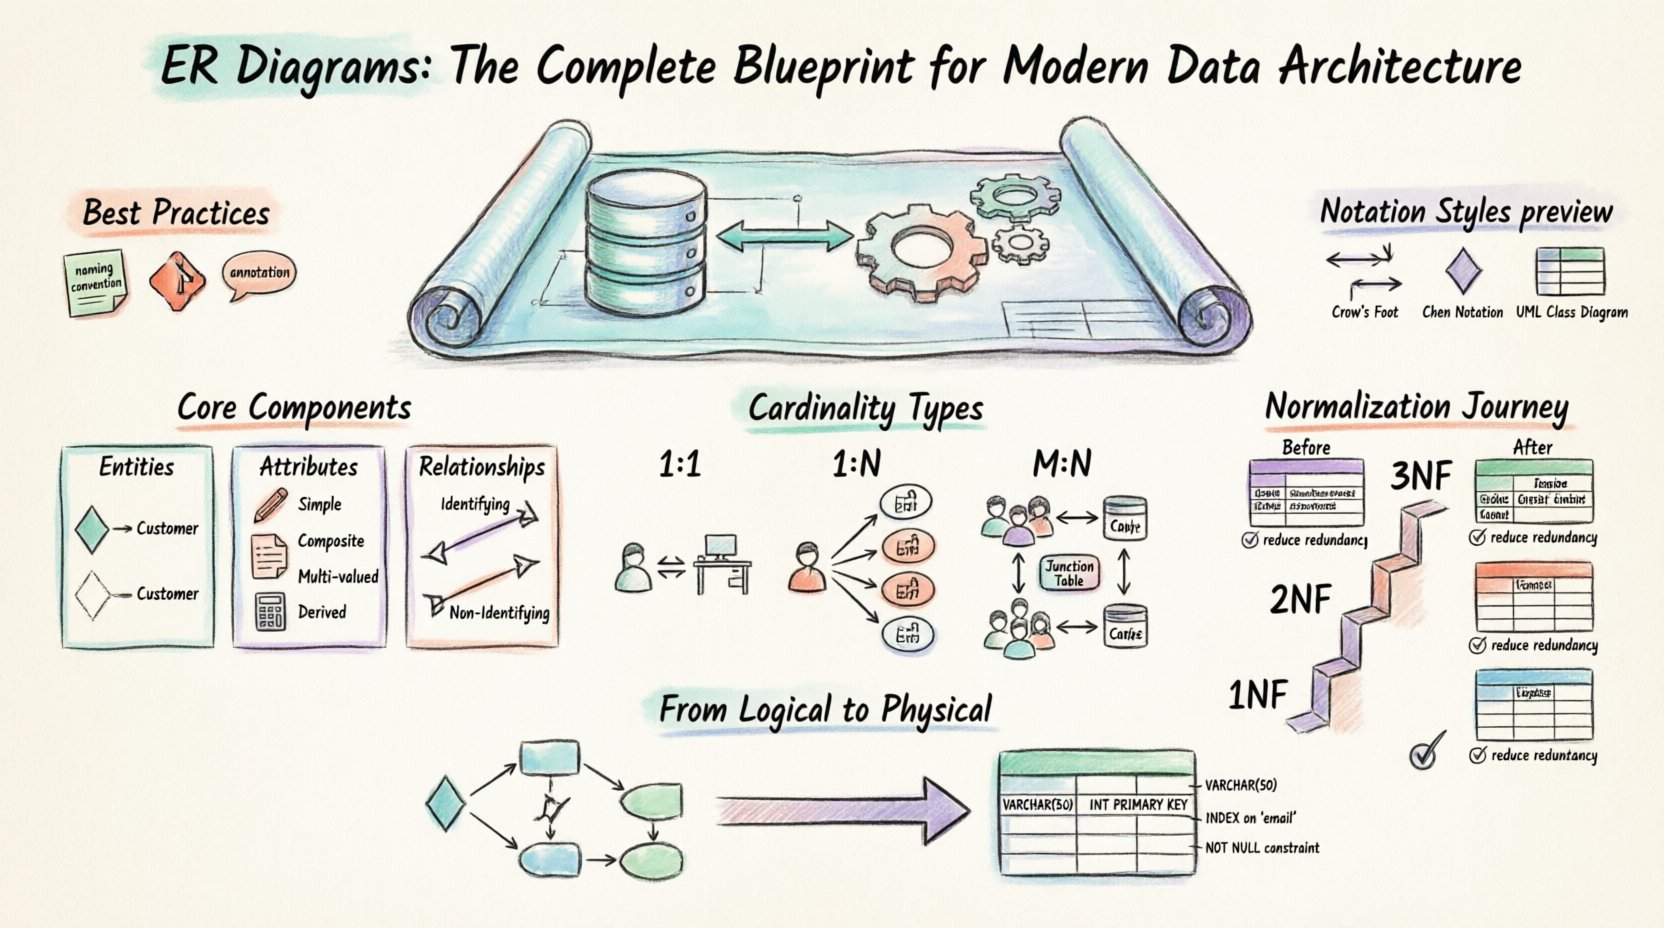
🏗️ Core Components of an ERD
To construct a valid diagram, one must understand the three fundamental building blocks. Every relationship and constraint in a database is derived from the interaction of these elements.
1. Entities
An entity represents a distinct object or concept within the business domain. In a database context, an entity typically maps to a table. Entities can be:
- Strong Entities: These exist independently and have their own primary key. For example, a Customer entity exists even without an associated Order.
- Weak Entities: These depend on a strong entity for their existence. An Order_Item cannot exist without a parent Order.
Entities are usually represented by rectangles in standard notation. They are named using singular nouns to represent the class of objects.
2. Attributes
Attributes describe the properties or characteristics of an entity. They are the columns within a table. Attributes fall into several categories:
- Simple Attributes: Indivisible values, such as a First_Name or Age.
- Composite Attributes: Attributes that can be divided into sub-parts, such as an Address (Street, City, Zip).
- Multi-valued Attributes: Attributes that can hold multiple values, such as Phone_Numbers or Skills.
- Derived Attributes: Values calculated from other attributes, such as Age derived from Date_of_Birth.
The most critical attribute is the Primary Key. This unique identifier distinguishes one record from another within an entity. Without a primary key, data integrity cannot be guaranteed.
3. Relationships
Relationships define how entities interact with one another. They indicate the constraints and associations between data points. Relationships are the connective tissue of the database.
- Identifying Relationships: A weak entity depends on a strong entity. The relationship determines the existence of the weak entity.
- Non-Identifying Relationships: Entities are independent. The relationship exists but does not dictate existence.
🔗 Understanding Cardinality and Modality
Cardinality defines the number of instances of one entity that can or must associate with each instance of another entity. This is often referred to as the “One-to-One”, “One-to-Many”, or “Many-to-Many” structure.
Modality refers to whether the relationship is mandatory or optional. Does a record must have a related record, or is it allowed to exist without one?
Cardinality Types
| Cardinality | Notation | Example Scenario |
|---|---|---|
| One-to-One (1:1) | One ─── One | One Employee has One Office Desk |
| One-to-Many (1:N) | One ─── Many | One Customer places Many Orders |
| Many-to-Many (M:N) | Many ─── Many | Many Students enroll in Many Courses |
Many-to-Many relationships are particularly important to note. In a physical database, a direct many-to-many link is not supported. It must be resolved by introducing an associative entity (a junction table) that breaks the relationship into two one-to-many relationships.
⚖️ Normalization Principles
Normalization is the process of organizing data to reduce redundancy and improve data integrity. It involves dividing large tables into smaller, logically connected tables and defining relationships between them. The goal is to ensure that each piece of data is stored in only one place.
First Normal Form (1NF)
The first step in normalization involves ensuring that:
- All column values are atomic (indivisible).
- There are no repeating groups or arrays within a single column.
- Each column contains only one value per row.
For example, a Skills column containing “Java, SQL, Python” violates 1NF. This should be split into separate rows or a separate table.
Second Normal Form (2NF)
A table is in 2NF if it is in 1NF and all non-key attributes are fully dependent on the primary key. This eliminates partial dependencies. If a table has a composite primary key, every non-key column must depend on the whole key, not just part of it.
Third Normal Form (3NF)
A table is in 3NF if it is in 2NF and there are no transitive dependencies. This means non-key attributes should not depend on other non-key attributes. For instance, if City depends on Zip_Code, and Zip_Code depends on Customer_ID, storing City in the Customer table creates redundancy. It is better to have a separate Zip_Code table.
📐 Notation Standards
Different notations exist to represent ERDs. While the underlying logic remains the same, the visual symbols vary. Choosing a standard ensures consistency across documentation.
- Crow’s Foot: The most common notation in modern database design. It uses lines with specific endings (like a bird’s foot) to indicate cardinality. It is intuitive and widely supported by design tools.
- Chen: An older notation where relationships are diamonds and entities are rectangles. It is very explicit about the nature of the relationship but can become cluttered in complex models.
- UML: Unified Modeling Language. Often used in software engineering, it adapts ER concepts to fit within the broader UML framework for system design.
🔄 From Logical to Physical Design
The journey from an abstract diagram to a functioning database involves moving from Logical to Physical models.
Logical Data Model
This model focuses on the structure of the data without regard to the specific database management system. It defines entities, attributes, and relationships using generic terms. It is technology-agnostic. This stage answers the question: “What data do we need and how does it relate?”
Physical Data Model
This model translates the logical design into the specifics of a database system. It defines data types (e.g., Integer, Varchar, Timestamp), indexes, constraints, and partitioning strategies. It answers the question: “How do we store this efficiently?”
During this transition, specific decisions are made:
- Data Types: Deciding between
INTvsBIGINTbased on expected volume. - Indexes: Adding indexes to columns used frequently in search conditions to speed up retrieval.
- Constraints: Enforcing
NOT NULLrules orUNIQUEconstraints at the database level. - Naming Conventions: Adopting a standard like
snake_casefor tables and columns to ensure readability.
🛡️ Common Challenges in Data Modeling
Even experienced architects face hurdles when designing ER diagrams. Recognizing these challenges early can prevent costly rework.
1. Ambiguity in Business Rules
Stakeholders often describe data needs vaguely. “We need to track users” could mean a simple list or a complex system with roles, permissions, and audit logs. Clear communication is vital to resolve these ambiguities before drawing lines on the diagram.
2. Over-Normalization
While normalization reduces redundancy, excessive normalization can fragment data across too many tables. This leads to complex joins that slow down query performance. A balance must be struck between data integrity and read performance.
3. Ignoring Future Growth
Designs often focus on current requirements. However, data models must accommodate future changes. A table designed for a single phone number should anticipate multiple numbers or international formats.
4. Missing Relationships
It is common to define entities but forget to link them. A Product table without a link to a Category table makes categorization impossible. Every entity should be reviewed to ensure it connects logically to the rest of the schema.
📋 Best Practices for Documentation
A diagram is only useful if it is understood. Documentation complements the visual model.
- Consistent Naming: Use clear, descriptive names. Avoid abbreviations unless they are industry standards.
- Version Control: Treat the schema like code. Track changes to the ERD over time to understand the evolution of the system.
- Annotations: Add notes to the diagram to explain complex business logic or exceptions that cannot be shown visually.
- Review Cycles: Regularly review the model with both technical and non-technical team members to ensure alignment.
🚀 The Role of ERD in Modern Systems
In the landscape of modern data architecture, the principles of ER modeling remain relevant despite the rise of NoSQL and graph databases. While the storage mechanisms change, the need to understand relationships and data integrity does not.
For SQL-based systems, the ERD is the primary design artifact. For NoSQL systems, it informs the document structure and embedding strategies. For Graph databases, it defines the nodes and edges explicitly.
Data modeling is not a one-time task. As business requirements evolve, the ERD must evolve with it. This iterative process ensures the data layer remains a strategic asset rather than a technical liability.
✅ Summary of Key Takeaways
- Foundation: ERDs are the blueprint for database design, ensuring logical consistency.
- Components: Entities, Attributes, and Relationships form the core triad of any model.
- Cardinality: Understanding 1:1, 1:N, and M:N relationships is critical for accurate data mapping.
- Normalization: Apply 1NF, 2NF, and 3NF to reduce redundancy and ensure integrity.
- Evolution: Move from Logical to Physical models to prepare for implementation.
- Documentation: Maintain clear naming conventions and version control for long-term maintenance.
By adhering to these principles, architects build systems that are not only functional today but adaptable for tomorrow. The ER diagram is more than a drawing; it is a contract between the business logic and the technical implementation.

