Designing products without talking to the people who will use them is like navigating a ship without a compass. You might move forward, but you are unlikely to reach the intended destination efficiently. User research is the compass. It provides direction, clarity, and confidence in the decisions you make. For beginners in UX design, understanding how to gather and interpret user feedback is not just an optional skill; it is the foundation of meaningful design.
This guide walks you through the essential steps of conducting user research. We will explore why it matters, how to choose the right methods, and how to turn raw data into actionable insights. No fancy tools are required to start. You simply need curiosity, empathy, and a structured approach.
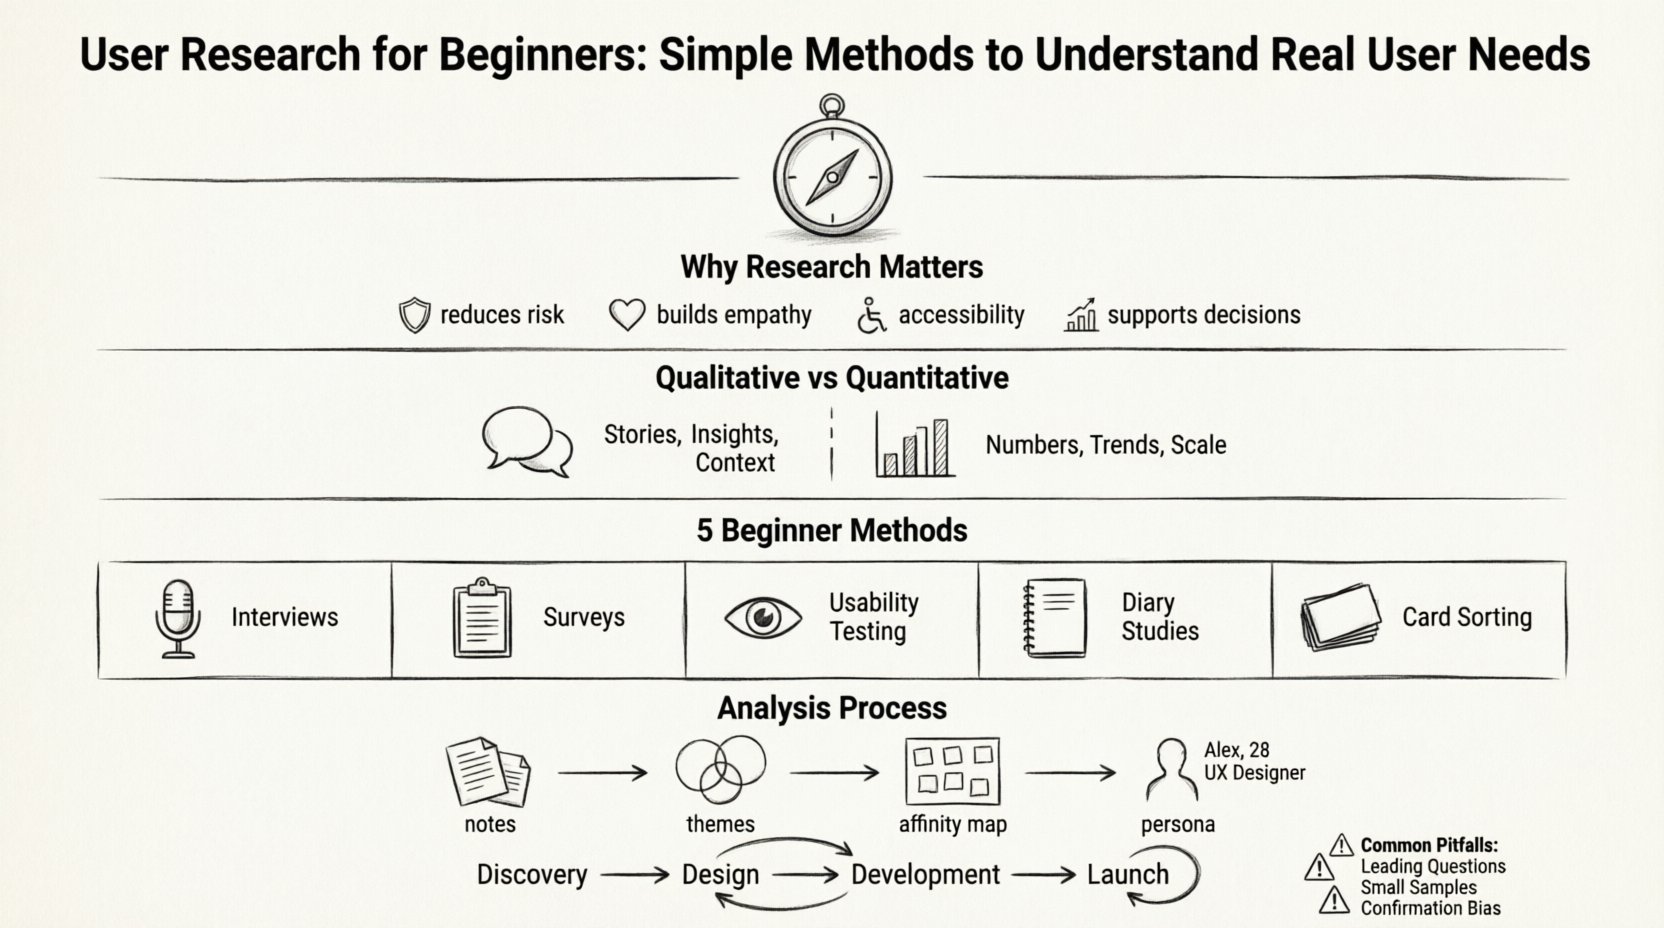
Why User Research Matters in UX Design 🌱
Many designers assume they know what users want. They rely on intuition or past experience. However, intuition can be misleading. Research grounds your work in reality. It shifts the focus from what you think is good to what actually works for the people using your product.
- Reduces Risk: Building a feature that nobody needs wastes time and resources. Research helps you validate ideas before development begins.
- Builds Empathy: Hearing directly from users humanizes the data. You stop designing for “the user” and start designing for specific people with real problems.
- Improves Accessibility: Research often reveals barriers that designers might overlook. It ensures your product is usable by a wider audience.
- Supports Decision Making: When stakeholders disagree, research data provides an objective basis for discussion.
Without research, you are guessing. With research, you are solving problems. The goal is not just to create a pretty interface, but to create a functional solution that meets real needs.
Qualitative vs. Quantitative Research 📊
Understanding the difference between qualitative and quantitative data is crucial. Both are valuable, but they answer different questions. Qualitative research explains why users behave a certain way. Quantitative research explains what is happening and how much.
| Aspect | Qualitative Research | Quantitative Research |
|---|---|---|
| Focus | Understanding motivations, feelings, and behaviors | Measuring frequency, quantity, and trends |
| Data Type | Words, observations, stories | Numbers, statistics, metrics |
| Sample Size | Small (e.g., 5-10 participants) | Large (e.g., hundreds or thousands) |
| Goal | Discovery and deep understanding | Validation and generalization |
| Example Question | How did you feel while completing this task? | How long did it take to complete this task? |
For beginners, it is often best to start with qualitative methods. They are easier to conduct without a large budget and provide rich context. As you grow, you can combine both types for a complete picture.
Top Research Methods for Beginners 🔍
You do not need a massive budget to gather insights. Here are five simple methods that yield high value.
1. User Interviews 🗣️
Interviews are one-on-one conversations designed to learn about a user’s experiences, needs, and challenges. This is the bread and butter of user research.
How to Conduct an Interview:
- Prepare a Script: Create a list of open-ended questions. Avoid questions that lead the participant toward a specific answer. For example, instead of asking “Did you like the checkout process?”, ask “Tell me about your experience checking out.”
- Recruit Participants: Find people who match your target audience. You can reach out through social media, community forums, or your existing network.
- Record the Session: With permission, record the conversation or take detailed notes. You cannot focus on listening and writing at the same time.
- Stay Silent: After asking a question, wait. Silence often prompts users to share more than they intended.
2. Surveys and Questionnaires 📝
Surveys allow you to gather data from many people quickly. They are excellent for validating trends you discovered in interviews.
Best Practices for Surveys:
- Keep it Short: People lose focus after 10-15 minutes. Aim for 5-10 minutes of completion time.
- Mix Question Types: Use multiple-choice for quantitative data and text boxes for qualitative feedback.
- Define Your Audience: Ensure your survey reaches the right people. Sending a survey to developers about consumer habits will yield poor results.
- Test the Survey: Ask a colleague to take the survey first to catch confusing questions or broken links.
3. Usability Testing 🧪
Usability testing involves watching users interact with your product or prototype. You observe where they struggle, what they click, and how they navigate.
Steps for Usability Testing:
- Define Tasks: Give users specific goals, such as “Find the contact information” or “Add an item to the cart.”
- Think Aloud: Ask users to speak their thoughts as they work. This reveals their mental model and confusion points.
- Observe, Don’t Help: Resist the urge to guide them. If they get stuck, let them try to figure it out. This reveals friction points.
- Debrief: Ask how they felt about the experience after the tasks are complete.
4. Diary Studies 📓
A diary study asks users to record their experiences over a period of time. This is useful for understanding behaviors that happen in the real world, not just in a lab.
- Longitudinal Data: You capture patterns over days or weeks, not just a single moment.
- Context: Users report on their environment, mood, and interruptions, which helps you understand the context of use.
- Engagement: This method requires commitment from the user, so keep the tasks simple.
5. Card Sorting 🃏
Card sorting helps you understand how users categorize information. This is vital for designing navigation and site architecture.
- Open Card Sort: Users organize cards into groups and name the groups. This reveals their mental models.
- Closed Card Sort: Users sort cards into predefined categories. This validates your existing structure.
- Virtual or Physical: You can use a shared whiteboard or physical cards on a table.
Analyzing and Synthesizing Data 🧠
Gathering data is only half the work. You must analyze it to find patterns. If you do not analyze the data, you cannot learn from it.
Step 1: Transcribe and Organize
Convert your interview recordings into text. Put all notes from surveys, tests, and interviews into a single repository. This makes it easier to compare findings.
Step 2: Identify Themes
Read through your notes and highlight recurring statements or behaviors. Look for:
- Common Pain Points: What problems do multiple users mention?
- Emotional Triggers: When do users express frustration or delight?
- Gaps: Where do user expectations differ from your design?
Step 3: Create Affinity Maps
An affinity map is a visual way to group your findings. Write each insight on a sticky note (digital or physical). Group similar notes together. This helps you see relationships between different data points.
Step 4: Develop Personas
A persona is a fictional character that represents a segment of your users. It is based on real data, not assumptions. Personas help your team remember who they are designing for. Include details like goals, frustrations, and background.
Common Pitfalls to Avoid ⚠️
Even experienced researchers make mistakes. Being aware of common pitfalls helps you maintain the integrity of your research.
- Leading Questions: Avoid questions that suggest the answer. “Don’t you think this button is too big?” implies it is too big. Ask “How does this button feel to you?” instead.
- Small Sample Sizes: Five users is often enough to find major usability issues, but not enough to understand broad market trends. Adjust your sample size based on your goals.
- Ignoring Negative Feedback: It is easy to focus on compliments. Negative feedback is often where the most valuable improvements lie.
- Designing for Yourself: It is tempting to test with friends or colleagues. They know too much about your process. You need strangers who are new to the product.
- Waiting Until the End: Do not wait until the final design is ready to test. Test early and often. It is cheaper to fix a wireframe than a coded feature.
Integrating Research into Your Workflow 🔄
Research should not be a separate phase at the start of a project. It should be woven into the entire process.
During Discovery
Use interviews and surveys to understand the problem space. Ask users about their current workflows and what frustrates them. This ensures you are solving the right problem.
During Design
Use low-fidelity prototypes for testing. Ask users to click through wireframes. This validates your information architecture before you spend time on visual design.
During Development
Continue to test high-fidelity designs. Check if the visual changes affect usability. Ensure the final product matches the specifications.
After Launch
Research does not stop at launch. Monitor analytics and collect feedback. Users’ needs change over time. Continuous research keeps your product relevant.
Building a Research Culture 🤝
Research is most effective when the whole team values it. If developers and stakeholders trust the data, they are more likely to support design decisions based on that data.
- Share Findings: Create a shared document or presentation. Summarize key insights for the team.
- Invite Others: Let developers or product managers join user sessions. Seeing a user struggle is more impactful than reading a report.
- Document Everything: Keep a repository of your research. Future projects can benefit from past insights.
Conclusion on User Research Practices 🏁
Starting with user research can feel overwhelming, but it does not require complex tools or large teams. It requires a commitment to listening. By using simple methods like interviews, surveys, and usability testing, you can build products that truly resonate with people.
Remember that research is a cycle. You learn, you design, you test, and you learn again. This iterative process leads to better outcomes for both the business and the user. Keep your questions open, your observations sharp, and your empathy strong.
The most successful products are those built with the user in mind. Research is the bridge that connects your ideas to their needs. Start small, stay consistent, and let the data guide your design journey.

