Every data architect faces the same pivotal moment. You start with a clean, normalized schema. The database handles thousands of records effortlessly. Queries return in milliseconds. The Entity Relationship Diagram (ERD) looks elegant. Then, the business grows. User adoption spikes. Data volume explodes. Suddenly, the system slows down. Joins take seconds. Locks block transactions. The original ERD design becomes a liability.
This guide details the transition from a small-scale database to a high-volume production environment. We explore the structural changes required to maintain performance without sacrificing data integrity. The focus remains on logical design, indexing strategies, and partitioning techniques. No specific vendor software is named here; the principles apply to any relational storage engine.
🏗️ The Baseline: Designing for Growth
When an application begins, the priority is speed of development. The ERD reflects the business domain accurately. Normalization is high. Third Normal Form (3NF) is often the goal. This minimizes redundancy. It ensures data consistency. However, this approach assumes a specific workload pattern. It assumes queries are simple. It assumes the dataset fits comfortably in memory.
As the dataset expands, the assumptions fail. The cost of joins increases logarithmically. The volume of data scanned by the query processor grows linearly. Disk I/O becomes the bottleneck. The architecture requires a shift from logical purity to physical performance.
Identifying the Breaking Point
Before refactoring, you must understand where the system fails. The transition from thousands to millions of records changes the physics of data retrieval. Look for these indicators:
- Query Latency: Queries that took 5ms now take 500ms.
- Lock Contention: Transactions wait for locks to release.
- Write Throughput: Inserts slow down due to index maintenance.
- Memory Pressure: The buffer pool cannot cache frequently accessed tables.
- Network Saturation: Large result sets consume bandwidth.
When these symptoms appear, the ERD must evolve. You cannot simply add more hardware. You must optimize the structure.
🔍 Phase 1: Schema Refactoring
The first step in scaling is auditing the Entity Relationship Diagram. You need to verify if the current structure supports the query patterns required at scale.
Normalization vs. Denormalization
Normalization reduces data duplication. It simplifies updates. However, it forces joins. Joins are expensive at scale. Denormalization introduces redundancy. It reduces joins. It speeds up reads. This is a trade-off that must be managed carefully.
nConsider the following strategies:
- Read-Heavy Workloads: Denormalize frequently accessed attributes. Store them directly in the main table to avoid joins.
- Write-Heavy Workloads: Maintain normalization. Avoid cascading updates across multiple tables.
- Hybrid Approach: Keep the core schema normalized. Create materialized views or summary tables for reporting.
In our case study, the original design had ten tables joined to retrieve a single user profile. This caused excessive disk I/O. By denormalizing the most common user attributes into the main profile table, we reduced the number of joins from ten to one.
Handling Large Text Fields
Storing large strings (CLOBs) in the main table can slow down page reads. The database engine must load the entire row to check the primary key. If the row is too large, it may spill to disk.
Best practices include:
- Separate large text fields into a linked table.
- Only fetch the text field when explicitly requested.
- Store references (IDs) instead of content in the main index.
📈 Phase 2: Indexing Strategies
Indexes are the engine of query performance. A well-designed ERD relies on indexes to locate data quickly. As records grow, index size grows. Maintaining indexes consumes write resources.
Composite Indexes
Single-column indexes are often insufficient. Composite indexes allow the engine to filter on multiple criteria simultaneously. The order of columns in the index matters. The most selective column should come first.
For example, if you filter by status and date, but status has low selectivity (e.g., only three values), place date first. This narrows the search space faster.
Covering Indexes
A covering index includes all columns required by the query. The database can satisfy the query using only the index. It does not need to touch the table data (heap). This is a significant performance win.
- Include all
SELECTcolumns. - Include all
WHEREclause columns. - Include all
ORDER BYcolumns.
Index Maintenance
Indexes are not static. They fragment over time. They grow with data. Regular maintenance is required.
- Rebuilding: Defragments the index structure.
- Reorganizing: Reorders leaf pages without full rebuild.
- Monitoring: Track unused indexes. Remove them to save write space.
🗄️ Phase 3: Partitioning and Sharding
When a single table exceeds the capacity of a single disk or memory pool, partitioning becomes necessary. This splits a logical table into smaller physical segments.
Range Partitioning
This method divides data based on a range value. Commonly used for dates or sequential IDs. For example, splitting data by year.
- Benefit: Queries filtering by the partition key scan only one segment.
- Drawback: Queries without the partition key scan all segments (full table scan).
Hash Partitioning
This distributes data evenly across segments using a hash function on a key column. It prevents hotspots.
- Benefit: Even distribution of data.
- Drawback: Range queries become expensive.
Horizontal vs. Vertical Sharding
Sharding takes partitioning further by distributing data across multiple database instances.
| Strategy | Description | Best Use Case |
|---|---|---|
| Horizontal Sharding | Split rows across databases based on a key. | High write volume, large datasets. |
| Vertical Sharding | Split columns across databases based on usage. | Large columns, distinct read patterns. |
| Directory Sharding | Use a lookup table to route queries. | Complex routing logic, dynamic scaling. |
In our case study, we implemented horizontal sharding based on the user ID. This allowed us to distribute the load across five nodes. Each node handled roughly 20% of the traffic. This reduced the load on any single storage engine.
🚀 Phase 4: Query Optimization
Even with a perfect schema, bad queries kill performance. The optimizer chooses the execution plan. You must guide it.
Avoiding Full Table Scans
Always ensure a query uses an index. If it scans the whole table, it will timeout at scale. Check the execution plan. Look for “Index Scan” or “Index Seek” instead of “Table Scan”.
Limiting Result Sets
Never fetch all records. Use pagination. Limit the number of rows returned per request.
- Offset Limit: Standard pagination. Can be slow on deep offsets.
- Keyset Pagination: Use the last seen ID to fetch the next page. Much faster.
Batching Operations
Do not perform millions of updates in a single transaction. Break them into batches.
- Commit after every 1,000 records.
- This reduces log file growth.
- This prevents long-running locks.
⚠️ Common Pitfalls to Avoid
Scaling introduces new risks. Be aware of these common mistakes.
- Over-Indexing: Too many indexes slow down writes. Monitor write performance.
- Ignoring Data Types: Using
VARCHARfor fixed-length IDs wastes space. UseINTorBIGINT. - N+1 Queries: Fetching related data in a loop. Use eager loading or batch joins.
- Soft Deletes: Marking records as deleted keeps them in the table forever. Archive old data.
- Locking Schemas: Changing table structure while the system is live. Use online schema changes.
📊 Performance Metrics to Track
You cannot improve what you do not measure. Establish a baseline. Monitor these metrics continuously.
- Rows per Second: How fast are data being written?
- Queries per Second: How much read traffic exists?
- Cache Hit Ratio: Are reads hitting memory or disk?
- Lock Wait Time: Are transactions waiting on resources?
- Disk I/O: Is storage saturated?
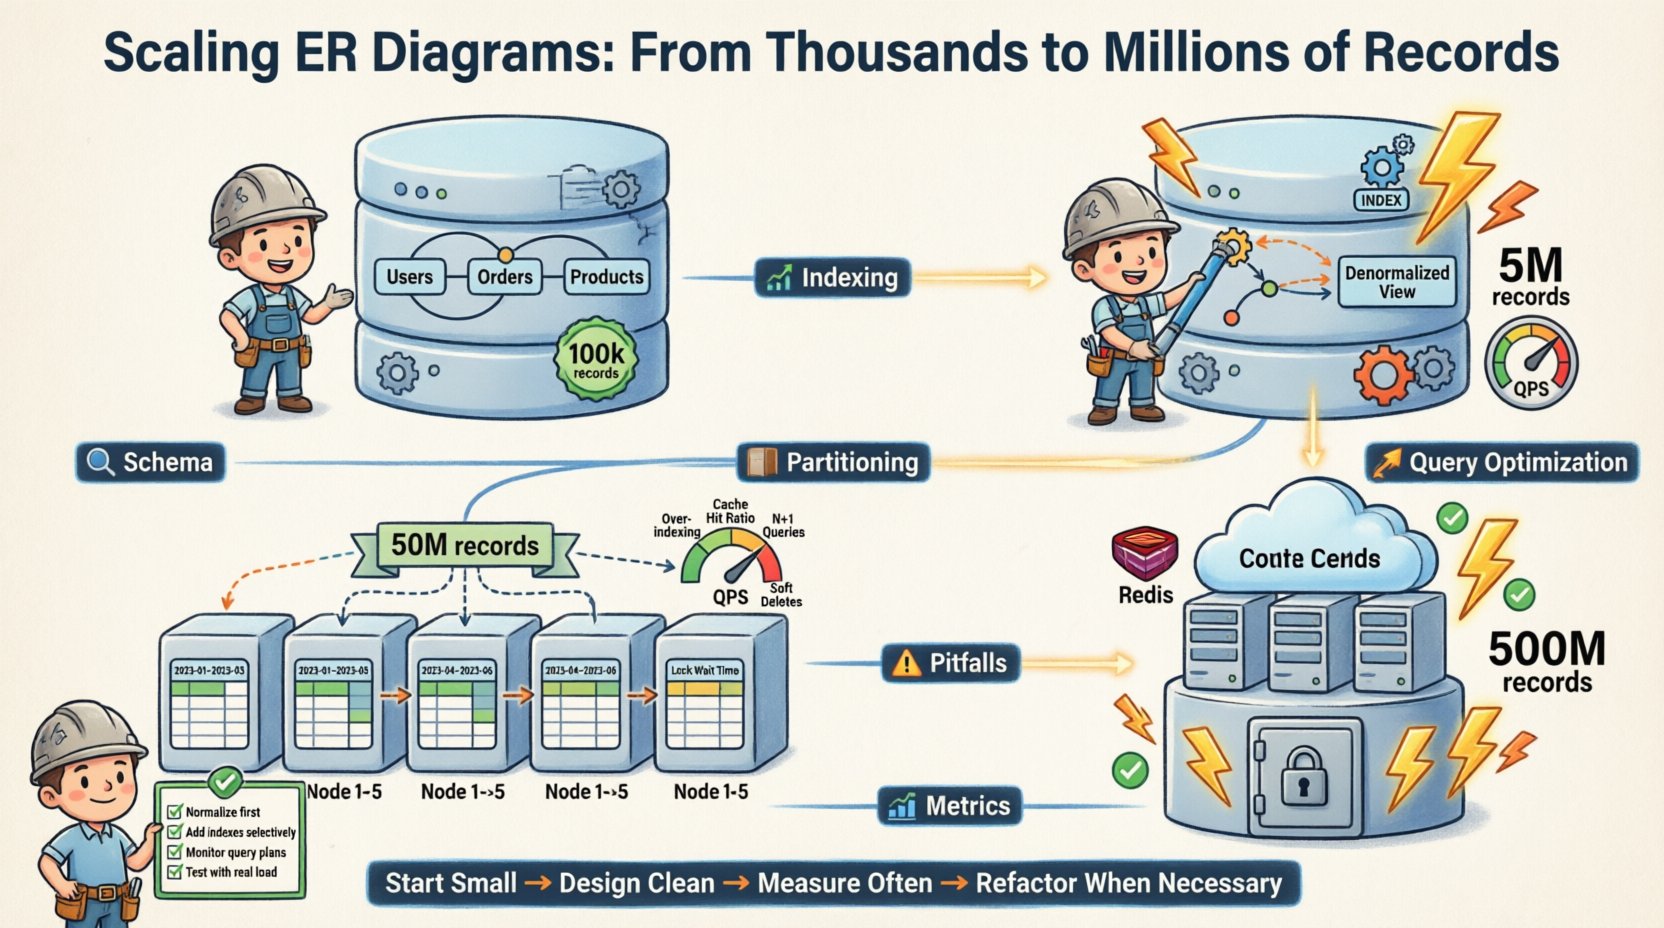
🔄 The Evolution of the ERD
The Entity Relationship Diagram is not a static document. It is a living blueprint. As the system scales, the ERD changes.
Here is the progression of our schema evolution:
- Phase 1 (Start): Fully normalized. 3NF. Single database instance. 100k records.
- Phase 2 (Growth): Denormalization of read-heavy tables. Added indexes. Single instance. 5M records.
- Phase 3 (Scale): Horizontal partitioning. Sharded by user ID. Multi-instance. 50M records.
- Phase 4 (Maturity): Archiving old data. Caching layer integration. Read replicas. 500M records.
Each phase required specific changes to the logical model. The core relationships remained stable. The physical implementation adapted.
🛠️ Checklist for Scaling
Use this checklist before deploying to a high-volume environment.
- ☐ Verify all foreign keys have supporting indexes.
- ☐ Check for
SELECT *in application code. - ☐ Ensure partitioning keys are distributed evenly.
- ☐ Test failover scenarios for database nodes.
- ☐ Review connection pool settings.
- ☐ Plan for data archiving and cleanup.
- ☐ Implement monitoring alerts for slow queries.
- ☐ Document schema change procedures.
💡 Final Thoughts on Reliability
Scaling an ER diagram is not just about speed. It is about reliability. A system that is fast but crashes under load is useless. A system that is slow but stable is manageable.
The goal is to design a structure that anticipates growth. You must balance the cost of storage against the cost of compute. You must balance consistency against availability. These are the fundamental trade-offs of distributed systems.
By following these principles, you can ensure your data architecture remains robust. You can handle the transition from thousands to millions without breaking. The key is preparation. The key is testing. The key is understanding the underlying mechanics of your storage engine.
Start small. Design clean. Measure often. Refactor when necessary. This is the path to sustainable scale.

