Designing a database structure is a foundational step in software development, yet it often feels daunting to beginners. You might think you need expensive software to start, but the core logic of data modeling exists independently of any specific application. This guide focuses on the Entity Relationship Diagram (ERD) fundamentals. By stripping away the digital clutter, you can understand the architecture of data using just a pen and paper.
Learning to draw an ER diagram manually sharpens your logical thinking. It forces you to define relationships clearly before writing a single line of code. Whether you are designing a simple inventory system or a complex e-commerce platform, the principles remain the same. In this walkthrough, we will explore the anatomy of a database schema, how to map relationships, and how to visualize data flow without relying on automated tools.
🤔 What Exactly is an ER Diagram?
An Entity Relationship Diagram is a visual representation of how data is organized within a system. It serves as a blueprint for your database. Instead of seeing rows and columns immediately, you look at the objects (Entities) and how they interact (Relationships). This high-level view helps stakeholders understand the business logic embedded in the data structure.
When you create an ERD, you are essentially answering three fundamental questions for every piece of data:
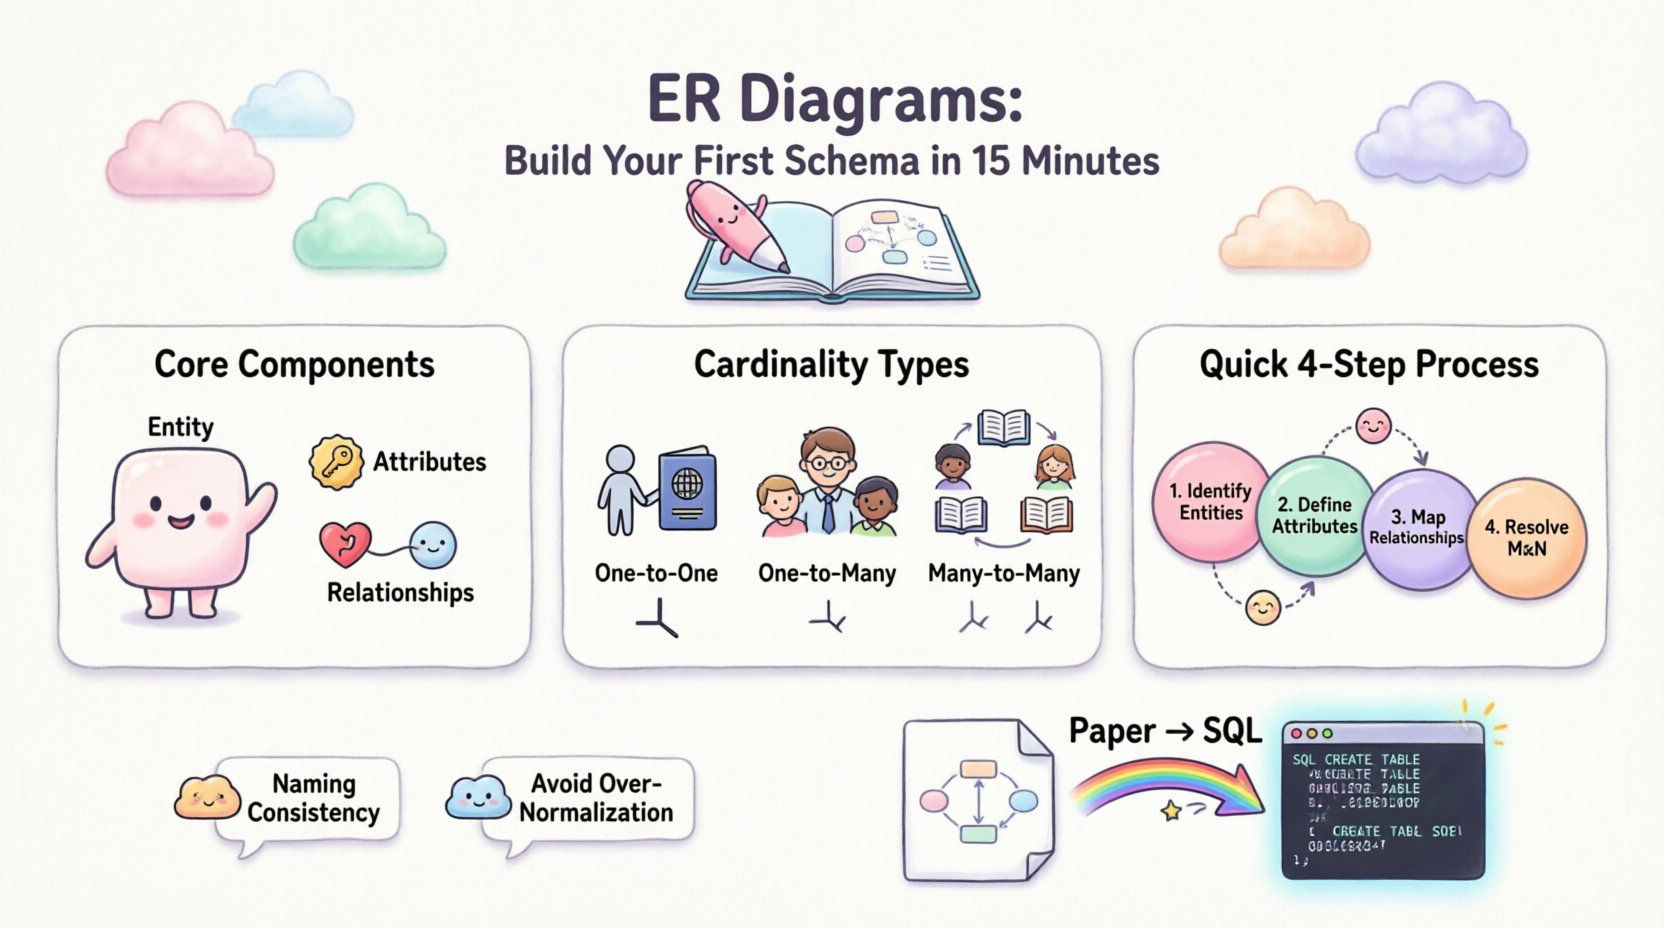
- What is the data describing? (The Entity)
- What details define that object? (The Attributes)
- How does this object connect to others? (The Relationships)
Without these visual aids, database design often becomes a guessing game. You might end up with redundant data or missing connections that break your application later. A well-constructed diagram prevents these issues before they happen.
🧱 Core Components of a Schema
Before drawing any lines, you must understand the building blocks. Every ER diagram consists of three primary elements. If you miss one, the model is incomplete.
1. Entities
An Entity represents a real-world object or concept about which you want to store information. In a physical database, this translates to a table. In a diagram, it is usually drawn as a rectangle.
- Example: In a library system, Book, Author, and Member are entities.
- Example: In an e-commerce store, Product, Customer, and Order are entities.
2. Attributes
Attributes are the specific pieces of information that describe an entity. These become the columns in your database table. They define the properties of the object.
- Example: For the Member entity, attributes might include MemberID, Name, Email, and JoinDate.
- Primary Key: One attribute must be unique for every record. This is often underlined or marked distinctly. For Member, the MemberID is the primary key.
- Foreign Key: An attribute that links to the primary key of another entity.
3. Relationships
Relationships define how entities interact. A line connecting two rectangles indicates a relationship. This tells you that data in one entity is connected to data in another.
- Example: A Member can borrow many Books.
- Example: A Book has one specific Author.
🔗 Understanding Relationships and Cardinality
Cardinality is the most critical concept in ER modeling. It defines the numerical relationship between entities. It answers the question: “How many instances of Entity A relate to one instance of Entity B?”. Misunderstanding cardinality leads to data duplication or orphaned records.
There are three main types of cardinality you will encounter:
| Cardinality Type | Description | Real-World Example |
|---|---|---|
| One-to-One (1:1) | One record in Table A relates to exactly one record in Table B. | A Person and their Passport. One person has one passport; one passport belongs to one person. |
| One-to-Many (1:N) | One record in Table A relates to many records in Table B. The reverse is not true. | A Department and Employees. One department has many employees, but each employee belongs to only one department. |
| Many-to-Many (M:N) | Many records in Table A relate to many records in Table B. | Students and Courses. A student takes many courses, and a course has many students. |
When drawing these on paper, you need to visualize how the lines connect. For a Many-to-Many relationship, you often need a junction table (or associative entity) to resolve the connection into two One-to-Many relationships. This is a crucial step in normalization.
✍️ Choosing Your Notation Style
There is no single universal standard for drawing ER diagrams, but two styles dominate the industry. Knowing which one to use helps you communicate effectively with other developers.
1. Crow’s Foot Notation
This is the most common style used in modern database design. It uses symbols at the end of the relationship line to indicate cardinality.
- Single Line: Indicates mandatory participation (must exist).
- Diamond or Fork: Indicates “Many”.
- Dash: Indicates “Optional” (Zero).
This notation is concise and widely supported by SQL tools. It is excellent for quick sketches on whiteboards.
2. Chen Notation
Named after Peter Chen, who introduced the concept, this style uses diamonds for relationships and ovals for attributes. It is more verbose but very explicit.
- Rectangle: Entity.
- Diamond: Relationship.
- Oval: Attribute.
While Chen notation is great for teaching concepts, it is less practical for complex schemas due to the number of shapes required. Most professional environments prefer Crow’s Foot for its compactness.
📄 Step-by-Step: Building Your First Manual ERD
Ready to draw? Let’s walk through creating a schema for a simplified Online Bookstore. We will assume you have a blank sheet of paper or a whiteboard. No software is required to get started.
Step 1: Identify the Entities
Read through the requirements. What are the main nouns? In this case, we need to track:
- Customer (Who buys)
- Order (The transaction)
- Product (What is sold)
- Category (How items are grouped)
Draw four rectangles on your paper. Label them clearly.
Step 2: Define the Attributes
For each rectangle, list the necessary details. Keep it simple for now.
- Customer: CustomerID, FirstName, LastName, Email, Address.
- Order: OrderID, OrderDate, TotalAmount, ShippingAddress.
- Product: ProductID, Name, Price, StockQuantity.
- Category: CategoryID, CategoryName, Description.
Circle the Primary Keys. Underline the ID fields to make them stand out.
Step 3: Map the Relationships
Now, draw lines between the entities based on the business rules.
- Customer to Order: One customer places many orders. (1:N)
- Order to Product: One order contains many products. One product can be in many orders. (M:N)
- Product to Category: One product belongs to one category. One category has many products. (1:N)
Step 4: Resolve the Many-to-Many
You identified that Order and Product have a Many-to-Many relationship. You cannot draw a direct line between them in a physical database without a bridge. You need a new entity.
- Create a new rectangle called OrderItem.
- Link Order to OrderItem (1:N).
- Link Product to OrderItem (1:N).
- Add attributes to OrderItem: Quantity, Subtotal.
This step transforms your conceptual model into a logical model ready for implementation.
🚫 Common Pitfalls to Avoid
Even with a solid understanding of concepts, beginners often make mistakes that complicate the schema. Watch out for these common issues.
1. Naming Conflicts
Using generic names like Data1 or TableA makes the diagram unreadable. Use descriptive business names. Instead of FK_Customer, use CustomerID. Consistency in naming conventions is vital for long-term maintenance.
2. Over-Normalization
While normalization reduces redundancy, creating too many tables can make queries slow and complex. If a relationship is rarely queried, consider keeping the data in a single table for performance. Balance integrity with usability.
3. Ignoring Null Values
Always consider if a field can be empty. If a Customer must have an email to register, mark it as Not Null. If a Product might not have a Category assigned yet, allow it to be Null. This logic belongs in the diagram’s constraints.
4. Circular Dependencies
Avoid creating loops where Entity A depends on B, B depends on C, and C depends on A. This creates a logical deadlock during data insertion. Always ensure a clear hierarchy or entry point for your data.
📈 From Paper to Production
Once your manual diagram is complete and approved, it is time to translate it into a database. This process is called physical modeling.
1. Translate to SQL
Each rectangle becomes a CREATE TABLE statement. Each Primary Key becomes a PRIMARY KEY constraint. Each relationship line becomes a FOREIGN KEY constraint. You can write this by hand or use a database client.
2. Validate Data Types
In your diagram, you wrote Price. In the database, you must decide if this is INT, FLOAT, or DECIMAL. For currency, always use DECIMAL to avoid rounding errors. This decision happens after the diagram is drawn.
3. Document the Logic
Keep your paper diagram in your project documentation. If you hire a new developer, this sketch explains the data structure better than code comments. It provides the context for why certain tables exist.
🎨 Tips for Effective Visual Design
Even without digital tools, presentation matters. A messy diagram is hard to read.
- Use Consistent Spacing: Keep rectangles aligned. Don’t let lines cross randomly.
- Label the Lines: Don’t just draw a line. Write “1” or “Many” near the ends to clarify cardinality immediately.
- Group Related Entities: If you have a group of tables related to “Billing”, place them close together on the page.
- Use Colors: If you have markers, use one color for Entities and another for Relationships. This visual distinction speeds up comprehension.
🛠️ Why Start Without Tools?
It is tempting to open a diagramming app immediately. However, starting with pen and paper offers unique benefits.
- Speed: You can sketch a rough layout in minutes. Moving shapes on a screen takes longer.
- Focus: Without drag-and-drop features, you focus on the logic, not the aesthetics.
- Flexibility: Erasing a mistake on paper is instant. Refactoring a digital diagram can be tedious.
- Collaboration: A whiteboard session allows a team to brainstorm changes in real-time without permission requests.
Once the logic is solid, you can import the concepts into a digital tool if needed. But the thinking process should always begin with the data itself, not the software interface.
📚 Next Steps for Your Data Journey
Now that you have a manual ERD, you can proceed to implementation. Start by creating the tables in a local development environment. Run the queries to insert dummy data. Check if the relationships hold true.
As your system grows, revisit your diagram. Add new entities for notifications or logs. Update attributes as requirements change. A database schema is not static; it evolves with the application.
By mastering the manual design process, you gain a deeper understanding of database architecture. You stop relying on wizards to build your structure and start making intentional decisions that optimize performance and integrity. This foundation will serve you well regardless of the technology stack you choose in the future.
Grab your pen, clear your desk, and start sketching. The logic of your future application begins with a simple line on a page.

