In modern development environments, the definition of completion has shifted. Simply finishing a task or writing code is no longer synonymous with delivering value. Teams are increasingly moving away from counting lines of code or checking boxes on a backlog board toward evaluating the actual impact of their work. This guide explores the critical shift from output to outcome, providing a framework for measuring success through completed user story outcomes.
Success in delivery is not a binary state of done or undone. It is a spectrum of value realization. When a story is marked as complete, the real question becomes: Did this change improve the experience for the end user? Did it solve the underlying problem? Did it move the business needle? Answering these questions requires a deliberate approach to measurement, validation, and feedback.
Understanding User Story Outcomes vs. Output 🔄
To measure success accurately, one must first distinguish between what is produced and what is achieved. This distinction forms the foundation of effective metric selection.
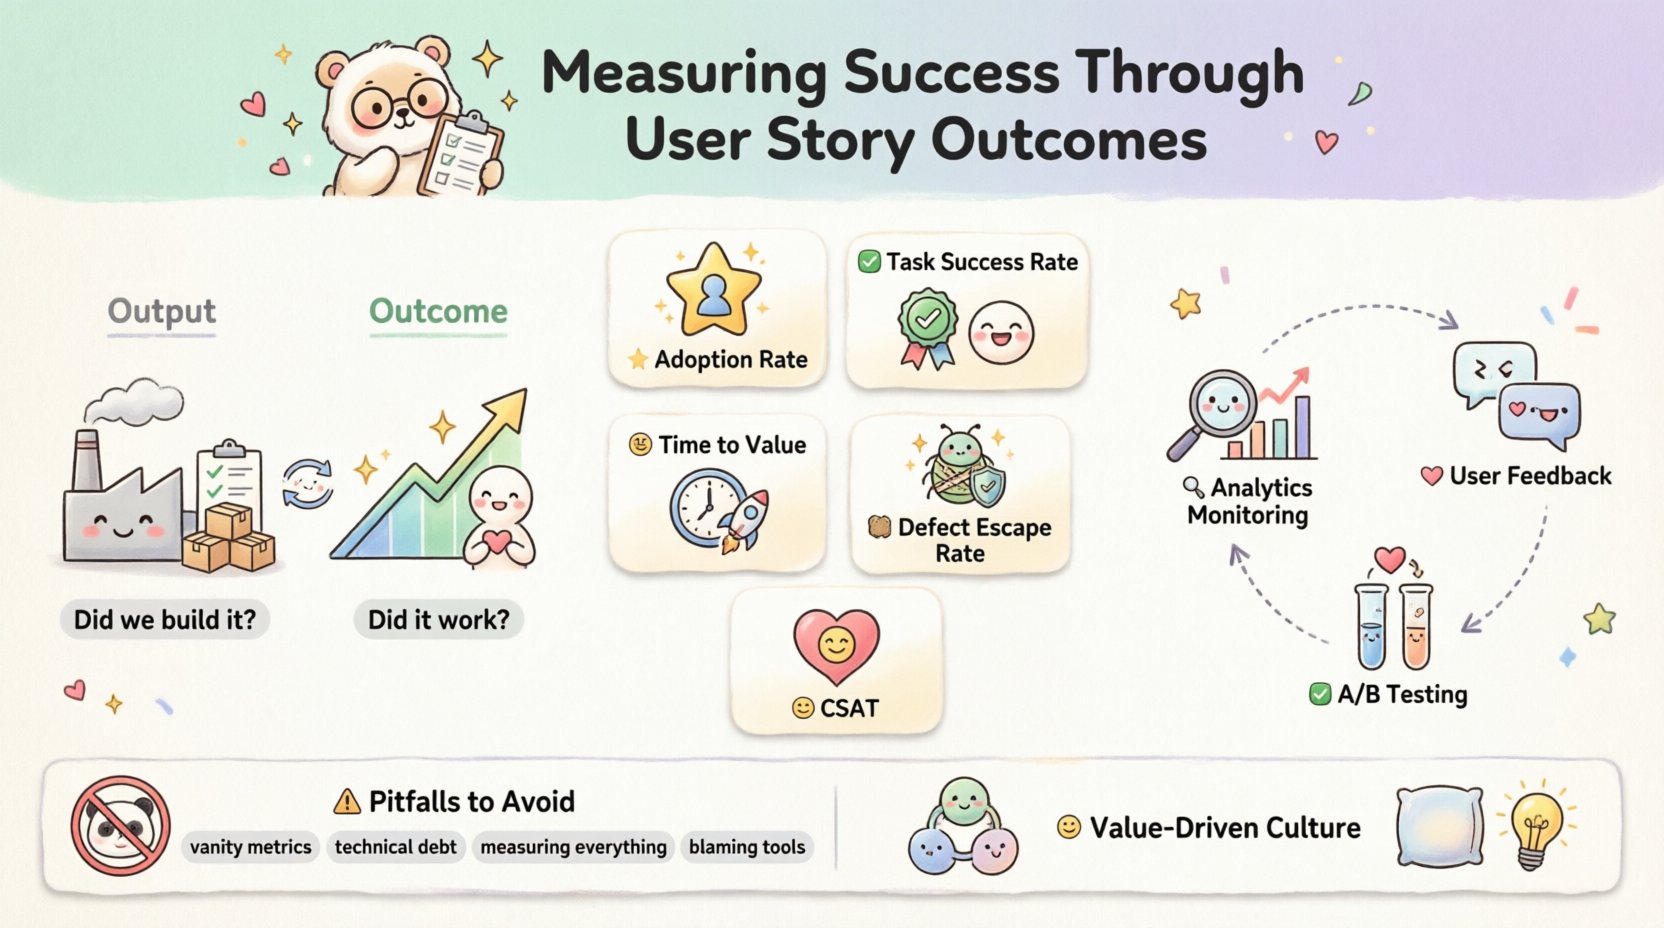
- Output: This refers to the tangible artifacts created. It includes the number of stories completed, the number of features shipped, or the velocity of the team. It answers the question, “Did we build it?”
- Outcome: This refers to the change in behavior or the value delivered to the customer. It includes increased retention, reduced support tickets, or improved task completion rates. It answers the question, “Did it work?”
Relying solely on output metrics can lead to “feature factory” syndrome, where teams are busy but stagnant. Outcome metrics force accountability for the result, not just the effort. This shift requires transparency and a willingness to accept that a completed story might not have achieved its intended goal if the outcome data does not reflect success.
Key Metrics for Measuring Success 📈
Selecting the right metrics is crucial. Too many metrics create noise; too few hide problems. The following table outlines essential metrics to track when evaluating user story outcomes.
| Metric | Definition | Why It Matters |
|---|---|---|
| Adoption Rate | The percentage of users who engage with a new feature after release. | Indicates if the solution is actually useful to the target audience. |
| Task Success Rate | The percentage of users who complete a specific task without assistance. | Measures usability and clarity of the implemented functionality. |
| Time to Value | The duration between release and the user deriving benefit from the feature. | Highlights efficiency in delivery and relevance of the solution. |
| Defect Escape Rate | The number of bugs reported by users after the story is marked complete. | Reflects the quality of the work and the effectiveness of testing. |
| Customer Satisfaction Score (CSAT) | Direct feedback from users regarding their experience with the change. | Provides qualitative validation of the outcome. |
When implementing these metrics, ensure they align with the specific intent of the user story. A story aimed at performance optimization should not be measured by adoption rates, whereas a story aimed at user engagement should not be measured solely by code stability.
Setting Clear Acceptance Criteria ✅
Acceptance criteria are the contract between the team and the stakeholders. They define the conditions under which a user story is considered complete. However, for outcome measurement, these criteria must extend beyond functional correctness.
- Functional Requirements: The system must behave in a specific way. (e.g., “The button must submit the form.”)
- Non-Functional Requirements: The system must meet performance or security standards. (e.g., “The page loads in under 2 seconds.”)
- Outcome-Based Criteria: The system must achieve a specific result. (e.g., “Users should be able to complete the checkout process without abandoning the cart.”)
Writing outcome-based criteria requires collaboration. It is not enough to say the feature is built; the team must define what success looks like in the real world. This often involves defining a hypothesis. For example, “If we implement this new navigation menu, then users will find products 20% faster.” To validate this, the acceptance criteria must include a mechanism for measurement. This could be a specific analytics event to track or a survey question to deploy upon feature access.
Post-Implementation Validation 🔍
Once a story is merged and deployed, the work is not finished. Validation is the bridge between development and value realization. This phase involves monitoring the system and gathering data to confirm the hypothesis.
1. Analytics Monitoring
Track the behaviors defined in your acceptance criteria. If the goal was to reduce clicks, verify the click path. If the goal was to increase conversion, monitor the funnel. Data should be available immediately after release to catch regressions or confirm gains.
2. User Feedback Loops
Numbers tell you what is happening; users tell you why. Engage with support teams to gather qualitative data. Look for patterns in tickets related to the new feature. Are users confused? Are they delighted? Direct feedback is often more actionable than raw numbers.
3. A/B Testing
When uncertain about the best approach, test variations. Deploying a feature to a small subset of users allows for controlled measurement. Compare the outcome metrics of the control group against the treatment group. This isolates the impact of the specific change.
Common Pitfalls in Measurement ⚠️
Even with the best intentions, teams often stumble when trying to measure success. Being aware of these common traps helps maintain integrity in the process.
- Vanity Metrics: Focusing on numbers that look good but do not correlate with business value (e.g., total sign-ups without retention analysis). Avoid metrics that can be manipulated without delivering real progress.
- Ignoring Technical Debt: Optimizing for speed often leads to quality issues. If a story is completed quickly but requires constant maintenance, the long-term outcome is negative. Measure the stability of the code as part of the story’s success.
- Measuring Everything: Tracking too many indicators dilutes focus. Select one or two key outcome metrics per story. If a metric is not actionable, do not measure it.
- Blaming the Tool: A lack of success is not always a tooling problem. It is often a problem of scope, understanding, or market fit. Avoid assuming the platform is the root cause of poor outcomes.
Integrating Feedback Loops 🔄
Measurement is useless without action. The data collected from completed user stories must feed back into the planning process. This creates a cycle of continuous improvement.
Retrospective Analysis: During team retrospectives, discuss the outcome data, not just the process. Did the story meet its goal? If not, why? Was the goal unrealistic? Was the implementation flawed?
Backlog Refinement: Use outcome data to prioritize future work. If a similar story failed to deliver value in the past, reconsider the approach or deprioritize it. If a pattern of success emerges, invest more heavily in that area.
Stakeholder Communication: Share outcome results with business leaders. Transparency builds trust. Showing that a feature was delivered but did not meet expectations demonstrates honesty and a commitment to value over vanity.
Cultivating a Value-Driven Culture 🤝
Metrics and processes are tools, but culture is the engine. A team that is afraid of failure will not measure outcomes honestly. They will manipulate data to make it look like success.
- Psychological Safety: Create an environment where admitting a story did not work is safe. This allows for honest post-mortems and learning.
- Shared Ownership: Everyone on the team, from developers to designers to product owners, should care about the outcome. Development is not just about code; it is about solving problems.
- Iterative Learning: Treat every story as an experiment. Even if the outcome is negative, the team has learned something valuable about the user or the system.
This cultural shift takes time. It requires consistent reinforcement from leadership. When the focus remains on solving problems rather than hitting deadlines, the team naturally gravitates toward better measurement practices.
Conclusion: The Journey of Value 🚀
Measuring success through completed user story outcomes is not a one-time setup. It is an ongoing discipline that requires vigilance and adaptation. By shifting focus from output to outcome, teams can ensure that their work truly matters.
Remember that the goal is not perfection, but progress. Every story completed provides an opportunity to learn. Use the metrics to guide decisions, not to judge performance. When the team aligns around value, the work becomes more meaningful, and the results become more impactful.
Start small. Pick one story. Define a clear outcome. Measure it. Learn. Repeat. This iterative approach builds a robust framework for success that scales with the organization.

