Business processes are the backbone of any organization. They define how work gets done, how information flows, and how value is delivered to customers. To communicate these processes clearly, professionals use a standardized language. This language is BPMN, or Business Process Model and Notation. If you have ever looked at a complex flowchart and felt lost, you are not alone. Reading a BPMN diagram requires understanding specific symbols, rules, and logic flows. This guide will walk you through the essential elements needed to interpret these diagrams effectively.
Whether you are a business analyst, a developer, or a stakeholder involved in process improvement, having the ability to read BPMN is crucial. It bridges the gap between technical teams and business units. By mastering the visual syntax, you can identify bottlenecks, clarify responsibilities, and ensure that everyone is on the same page. Let us dive into the mechanics of reading these diagrams.
What is BPMN? 🏷️
BPMN is a standard for business process modeling. It provides a graphical notation that is easily understood by all business stakeholders. Unlike standard flowcharts, BPMN is designed to capture the nuances of real-world business scenarios. It allows for the modeling of complex logic, including exceptions, parallel tasks, and asynchronous interactions.
When you look at a BPMN diagram, you are looking at a map of activity. It shows:
- Who is doing what (Roles and Responsibilities)
- What steps are involved (Activities)
- When things happen (Events)
- How decisions are made (Gateways)
- How information moves between steps (Connectors)
The standard is maintained by the Object Management Group (OMG). Because it is an international standard, a diagram created in one environment can be understood by anyone trained in the notation, regardless of the software used.
The Core Building Blocks 🧱
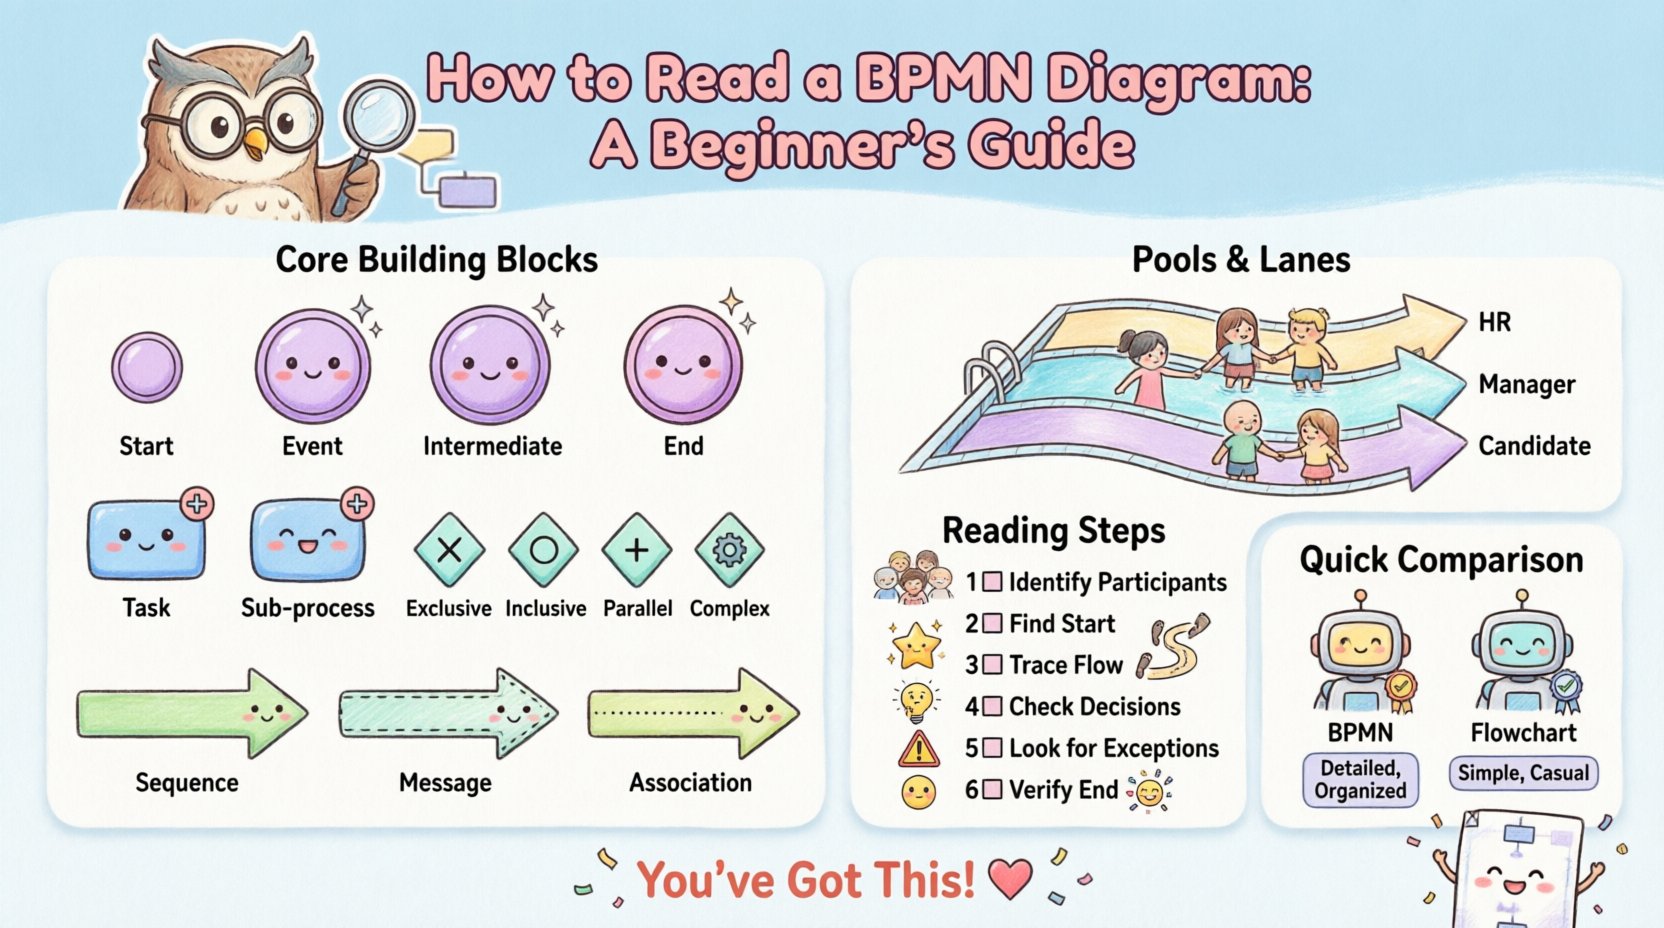
To read a BPMN diagram, you must first understand the shapes. There are four main categories of shapes used in BPMN. If you know these categories, you can decode almost any diagram.
1. Events 🟣
Events are things that happen during a process. They are represented by circles. Events generally define the start, middle, or end of a flow. They are categorized into three types:
- Start Events: These trigger the process. They are depicted as a circle with a thin border. There is no arrow entering a start event. It signifies where the process begins.
- Intermediate Events: These occur during the process. They are depicted as a circle with a double border (sometimes a single line inside). They represent waiting for a message, a timer, or an error. They can interrupt the flow or simply mark a point in time.
- End Events: These mark the conclusion of the process. They are depicted as a circle with a thick border. Once an end event is reached, the specific process instance is finished.
When reading a diagram, look for the start event to understand the trigger. What initiates the work? Is it a customer order? A scheduled report? Then, follow the path to the end event. Does the process end successfully, or are there different outcomes?
2. Activities 🔵
Activities represent work that is performed. They are represented by rounded rectangles. This is where the actual effort happens. There are two main types:
- Tasks: These are the smallest unit of work. A task is an action that cannot be broken down further within the context of the diagram. Examples include “Approve Invoice” or “Send Email”.
- Sub-processes: These are complex activities that can be expanded. They are represented by a rounded rectangle with a plus sign in the center. This indicates that the task contains more detailed steps which are defined in a separate diagram or expanded view.
Reading activities involves asking: “What is the work being done?” and “Who is doing it?” (more on that in the Swimlanes section). If you see a Sub-process, understand that the diagram is abstracting detail to keep the view manageable.
3. Gateways 🔶
Gateways control the divergence and convergence of the flow. They determine the path the process takes next. They are represented by diamonds. There are several types of gateways, and understanding them is critical for reading logic.
- Exclusive Gateway (XOR): This is the most common decision point. It means “One or the other, but not both.” It is shown as a diamond with an ‘X’ inside. For example, if a loan application is approved, go one way. If rejected, go another.
- Inclusive Gateway (OR): This allows for multiple paths to be taken simultaneously. It is shown as a diamond with a circle inside. For example, a process might need to notify both the customer and the manager.
- Parallel Gateway (AND): This splits the flow into multiple paths that happen at the same time. It is shown as a diamond with a plus sign inside. It is used for concurrency.
- Complex Gateway: This handles complex logic that does not fit the standard types. It is a diamond with a gear inside.
When reading gateways, look for the condition labels on the outgoing lines. These conditions (often true/false or specific values) dictate the flow direction.
4. Connectors 🟢
Connectors link the shapes together. There are three main types:
- Sequence Flow: A solid line with an arrow. It shows the order of activities. It is the default flow.
- Message Flow: A dashed line with an open arrow. It shows the exchange of information between different pools (organizations or systems). It does not represent the order of work, but rather communication.
- Association: A dotted line. It connects text annotations or data objects to activities without controlling the flow.
Understanding Responsibility: Pools and Lanes 🏊
A BPMN diagram often involves more than one person or system. To manage this, the notation uses Pools and Lanes.
Pools 🏊
A Pool represents a distinct participant in the process. It is a large rectangle that contains the entire process for that participant. If you see multiple pools side-by-side, it means multiple independent entities are interacting. For example, a “Customer” pool and a “Bank” pool.
Lanes 🏊
Lanes divide a single Pool into sub-categories of responsibility. They are horizontal or vertical strips inside a Pool. Each Lane represents a specific role, department, or system.
When reading a diagram with lanes:
- Identify the Lane headers to understand the roles involved.
- Trace the activities within a lane to see what that role is responsible for.
- Look at how activities cross between lanes. This indicates handoffs or interactions between roles.
For example, in a hiring process, one lane might be “HR,” another “Hiring Manager,” and another “Candidate.” The diagram shows how the application moves between these roles.
Common Patterns and Logic Flows 🔄
Once you understand the shapes, you can look at the patterns. Certain configurations of shapes create common process behaviors. Recognizing these patterns speeds up your ability to read the diagram.
Sequential Flow
This is the simplest pattern. Activity A leads to Activity B, which leads to Activity C. It is a straight line of tasks. This is common in linear processes like approval chains.
Parallel Processing
When a Parallel Gateway (AND) is used, the process splits. Multiple tasks happen at the same time. The process waits for all parallel paths to complete before continuing. This is common in manufacturing or IT deployments where multiple steps must finish before the next phase begins.
Loops and Iterations
Process flows are not always linear. Sometimes a process repeats. A loop occurs when a path leads back to an earlier point. This is often controlled by an Exclusive Gateway. For example, “Is the data correct?” If no, send back to “Edit Data”. If yes, continue.
Reading the Diagram: A Step-by-Step Approach 📝
How do you approach a new diagram? Do not just look at the shapes randomly. Use a systematic method.
- Identify the Participants: Look at the Pools and Lanes. Who is involved?
- Find the Start: Locate the Start Event. What triggers the process?
- Trace the Flow: Follow the Sequence Flow lines. Do not jump around. Move step-by-step.
- Check Decisions: When you hit a Gateway, read the conditions. Map out the possible paths.
- Look for Exceptions: Are there Error Events? These show what happens when things go wrong.
- Verify the End: Does every path lead to an End Event? If a path has nowhere to go, it is a logic error.
Data and Annotations 📄
BPMN diagrams often include data objects. These are represented by a document icon. They show what information is created, used, or modified during a task. While they do not control the flow, they provide context.
Annotations are text notes attached to the diagram via dotted lines. They provide extra information that is not part of the core flow. When reading, these help clarify why a specific step exists or what specific rules apply to a task.
Common Mistakes When Reading BPMN ❌
Even experienced professionals can misinterpret diagrams if they rush. Here are common pitfalls to avoid:
- Confusing Message Flow with Sequence Flow: Message flows cross Pools. Sequence flows stay within Pools. Mixing them up changes the meaning of the interaction.
- Ignoring Gateway Conditions: A Gateway without a condition is ambiguous. Always look for the labels on the outgoing lines.
- Overlooking Sub-processes: A Sub-process hides detail. If you need to understand the exact steps, you must open the Sub-process.
- Assuming Synchronization: Just because lines meet does not mean they wait. Only Parallel Gateways guarantee synchronization (waiting for all paths).
Comparison: BPMN vs. Standard Flowcharts 📊
Many people confuse BPMN with standard flowcharts. While they look similar, they serve different purposes.
| Feature | BPMN | Standard Flowchart |
|---|---|---|
| Complexity | Designed for complex business logic | Designed for simple logic |
| Roles | Explicitly handles Swimlanes and Pools | Roles are often implied or ignored |
| Interactions | Clear distinction between internal flow and external messages | Lines are generic |
| Standardization | OMG Standard (Global) | Varies by organization |
| Execution | Can often be executed by engines | Usually for documentation only |
Understanding this distinction helps you know when to use BPMN. If you need to automate a process or define complex interactions between systems, BPMN is the correct choice. For simple internal memos, a standard flowchart may suffice.
Best Practices for Creating and Reading Diagrams ✅
To ensure a diagram is readable, creators should follow specific guidelines. Readers should look for these signs of quality.
- Consistent Naming: Tasks should have clear, verb-noun names (e.g., “Validate Credit” not “Check”).
- Minimize Crossing Lines: A diagram with tangled lines is hard to follow. Layout should be clean.
- Appropriate Detail: Do not mix high-level strategy with low-level technical steps in the same view.
- Clear Gateways: Every Gateway should have a defined condition for every outgoing path.
- Start and End: Every process must start and end. Orphaned tasks confuse the reader.
Advanced Concepts: Error Handling and Compensation 🛡️
In real-world business, things go wrong. BPMN has specific symbols for this. An Error Intermediate Event is a circle with a warning icon. It shows that a specific error has occurred, such as a network failure or a validation error.
Compensation is another advanced concept. If a process fails halfway through, sometimes you need to undo previous steps. A compensation boundary event indicates that a specific task has a defined rollback procedure. This is vital for processes involving financial transactions or data entry.
Why This Skill Matters 💡
Being able to read BPMN is more than a technical skill. It is a communication skill. It allows you to discuss process improvements with stakeholders who may not be technical experts. It reduces ambiguity. It helps prevent errors in automation. When you can read the diagram, you can spot the risks before the process is implemented.
For organizations, clear process modeling reduces costs. It eliminates redundant steps. It clarifies ownership. It ensures compliance with regulations. Therefore, the ability to interpret these diagrams is a high-value asset for any professional.
Wrapping Up 🎓
Reading a BPMN diagram is a learned skill. It requires familiarity with the symbols, an understanding of the logic flow, and the ability to trace the path from start to finish. By breaking the diagram down into Events, Activities, Gateways, and Connectors, the complexity becomes manageable.
Remember to look for the Pools and Lanes to understand responsibility. Pay attention to the Gateway conditions to understand the logic. Use the data objects and annotations to add context. With practice, you will be able to look at a complex diagram and immediately understand the business process it represents.
Start by practicing on simple diagrams. Gradually move to more complex ones involving parallel flows and exceptions. As you become comfortable, you will find that the language of BPMN becomes a natural way to think about how work gets done.

