Introduction
In today’s fast-paced product development environments, project managers—especially those leading Agile teams—need more than just task lists. We need clarity, adaptability, and visual tools that help teams align, anticipate bottlenecks, and deliver value iteratively. While Agile methodologies emphasize flexibility over rigid planning, visualization tools like Gantt and PERT charts still play a vital role in roadmap communication, stakeholder alignment, and cross-functional coordination.

This guide breaks down the core differences between Gantt and PERT charts, explores their practical applications through the lens of an Agile project manager, and showcases how modern AI-powered tools can accelerate your planning workflow—without sacrificing the responsiveness Agile teams demand.
Understanding PERT Charts
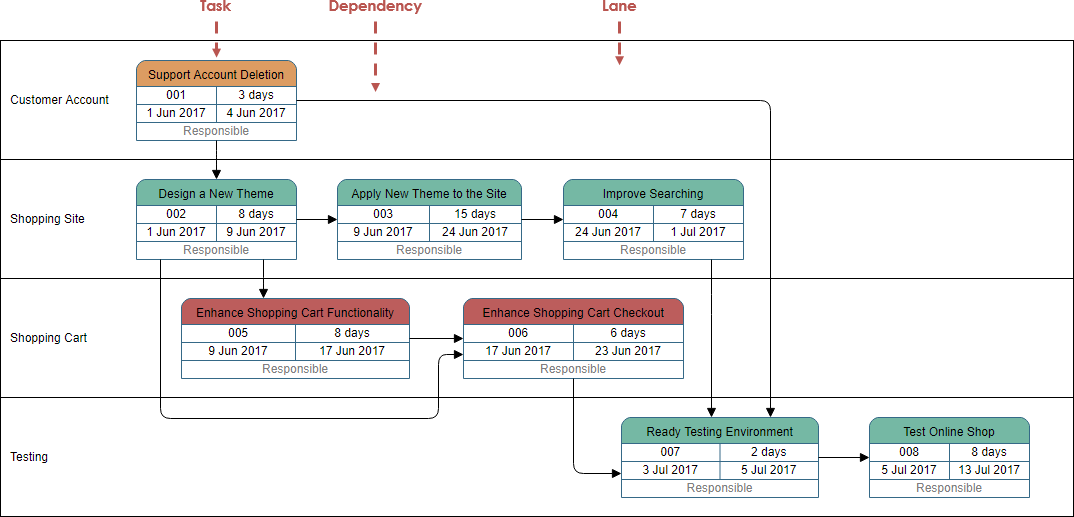
PERT (Program Evaluation and Review Technique) charts are network diagrams that visualize task dependencies and critical paths. Developed by the U.S. Navy for complex, time-sensitive projects, PERT charts excel at mapping out relationships between tasks rather than just their timing.
Key Characteristics:
-
Uses nodes (boxes) for tasks and arrows for dependencies
-
Flows left-to-right with flexible vertical positioning
-
Highlights the critical path—the sequence of tasks that determines minimum project duration
-
Ideal for projects with uncertain timelines or high interdependency
Agile PM Perspective:
“In my experience leading sprint planning for a SaaS product team, I rarely use a full PERT chart for day-to-day work. However, when onboarding a new module with complex backend/frontend dependencies, sketching a lightweight PERT diagram helps the team visualize ‘what blocks what’ before we commit to sprint goals. It’s a strategic tool for risk assessment, not daily tracking.”
Understanding Gantt Charts
A Gantt chart is a horizontal bar chart that maps tasks against a timeline. Created by Henry L. Gantt in the early 1900s, it remains one of the most intuitive ways to communicate project schedules to stakeholders.

Key Characteristics:
-
Tasks listed on Y-axis; time intervals on X-axis
-
Bar length = task duration; position = start/end dates
-
Modern versions support dependency links, progress tracking, and resource allocation
-
Excellent for visualizing milestones, deadlines, and team capacity
Agile PM Perspective:
“I use Gantt charts primarily for roadmap communication with executives and cross-functional partners. While our dev team works in two-week sprints tracked in Jira, a high-level Gantt view helps marketing, sales, and leadership understand release windows and feature rollouts. I keep it lightweight—focusing on epics, not user stories—to avoid the ‘waterfall trap’.”
PERT vs Gantt: Side-by-Side Comparison
| Gantt Chart | PERT Chart |
|---|---|
| Bar chart format | Network diagram format |
| Developed by Henry L. Gantt | Developed by U.S. Navy |
| Best for small to mid-size projects | Scales well for large, complex projects |
| Focus: Task duration & timeline | Focus: Task dependencies & critical path |
| Simple, intuitive for stakeholders | Can be complex; better for planners |
| Time-driven visualization | Dependency-driven visualization |
Visual Comparison
A Pert Chart:
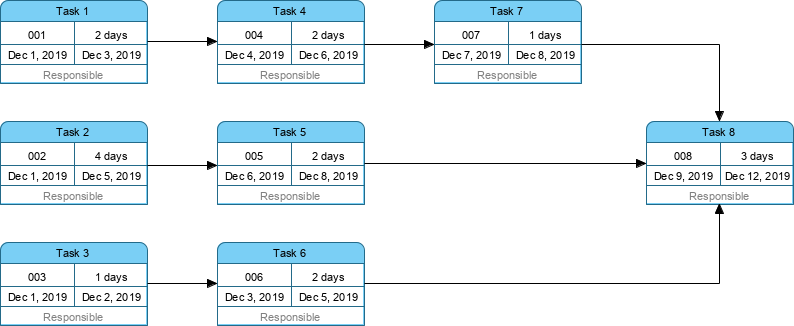
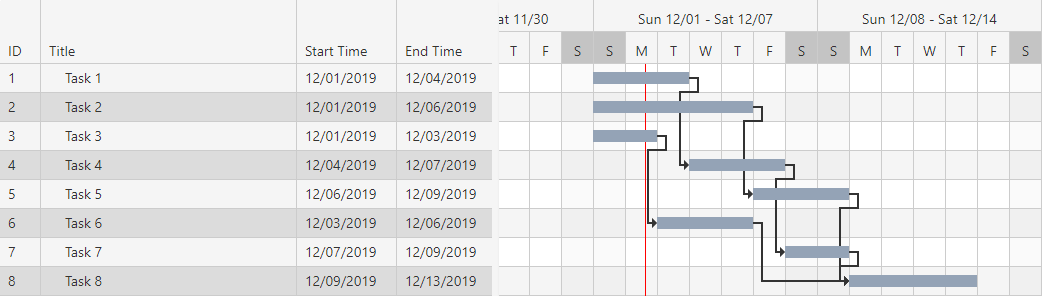
The ‘Gantt Chart version” of the PERT Chart above:
When to Use Which: Practical Guidance for Agile Teams
Use a Gantt Chart when:
-
Communicating timelines to non-technical stakeholders
-
Planning release trains or quarterly roadmaps
-
Tracking progress against fixed deadlines (e.g., compliance, marketing campaigns)
-
Visualizing team capacity across sprints
Use a PERT Chart when:
-
Mapping complex technical dependencies (e.g., microservices architecture)
-
Conducting risk analysis for new initiatives
-
Estimating minimum project duration under uncertainty
-
Onboarding new team members on system interdependencies
Hybrid Approach (Recommended):
“I often start with a PERT-style dependency map during discovery, then translate key milestones into a simplified Gantt for stakeholder reviews. Tools that support both views let me switch contexts without rebuilding plans from scratch.”
Leveraging AI Tools for Modern Chart Creation
Modern project management doesn’t require manual diagramming. AI-powered tools can generate, convert, and refine charts from plain-language prompts—saving hours of setup time.
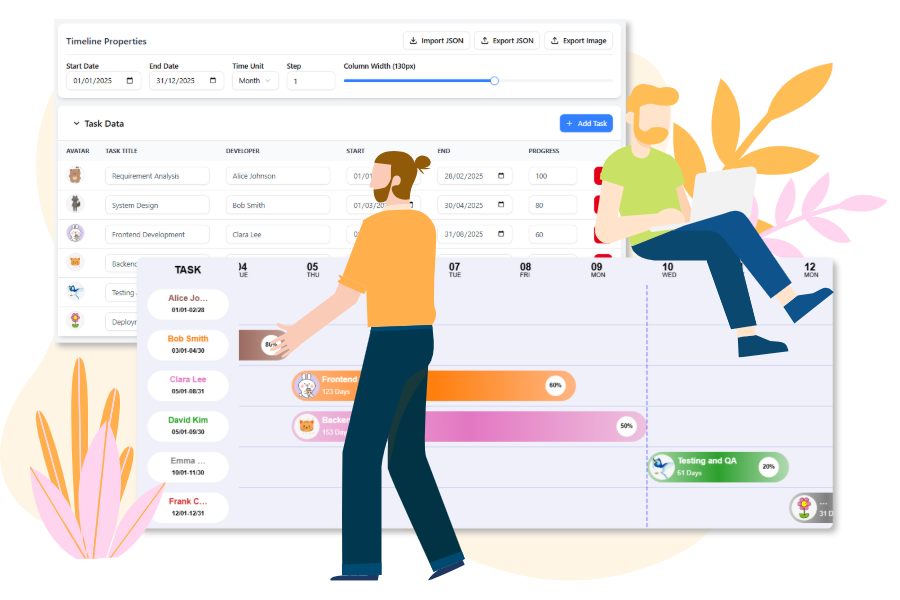
Instant Gantt Chart Builder
The free workspace for project managers and developers. Build, customize, and generate production-ready Gantt Chart configuration code instantly.
Try It Now
Core Features: Design, Configure, Generate
Leverage the power of cutting-edge visualization technology with a user-friendly frontend.

Interactive Timeline
Easily configure the Date Range, Time Unit (day, week, month), and Column Width using simple sliders and pickers.

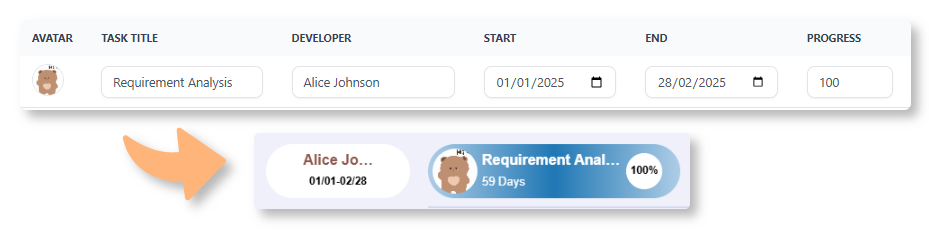
Dynamic Task Editor
Manage tasks by adding progress percentage, set dates, and assign developers with customizable avatars.

Live Preview
See changes instantly on the Gantt Chart below to view the progress clearly in a visual way.

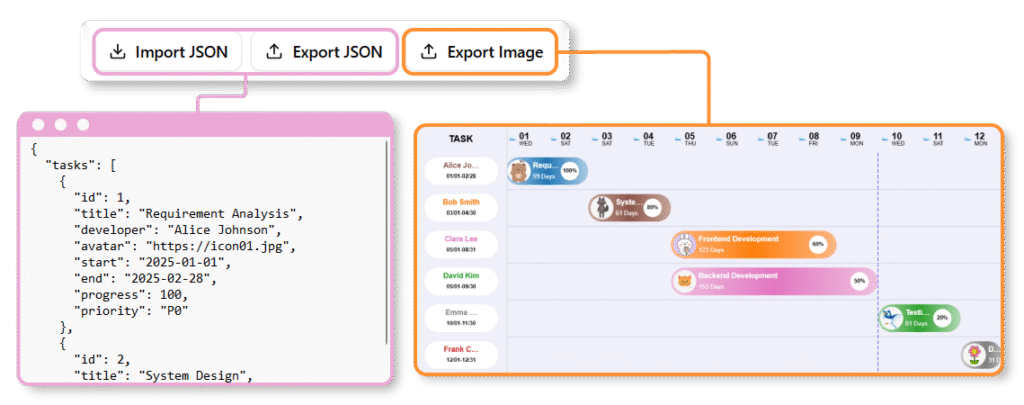
Image Export
Export the Gantt Chart as image to share your latest work to your team members.
How to Build Your Gantt Chart
Create your comprehensive project plan using only the visual interface.
01 | Input Tasks in the Data Table
Enter each project task, including the Start Date, End Date, Assigned Team Member, and Progress (%), directly into the spreadsheet-like data editor.
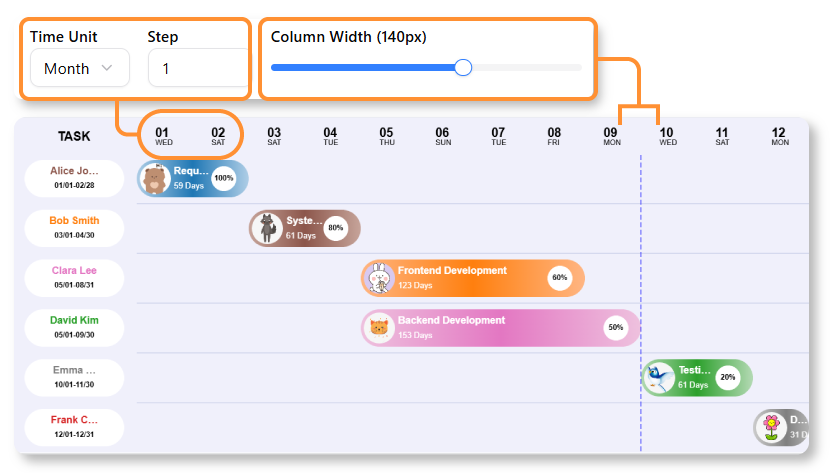
02 | Visualize & Customize the Timeline
Use the control panel to adjust the overall project Date Range and change the time scale from Days to Weeks or Months. See your tasks instantly rendered as interactive bars on the chart.
03 | Review & Export
Review and confirm the final visual output. You can export the Gantt Chart to image, and also share the data by the JSON to your team members.
AI-Powered Workflows for Agile PMs
Visual Paradigm provides several AI-driven ways to generate and manage charts instantly from text:
-
AI Development Plan Generator: Creates an Instant Visual Timeline Diagram alongside a textual plan.
-
Describe Your Project: Enter a clear goal and constraints (e.g., “Plan a 3-month website redesign”)
-
Generate: AI produces a detailed task breakdown and visual timeline
-
Refine: Adjust durations, add dependencies, or modify the plan directly
-
-
AI Chatbot (for PERT-to-Gantt Conversion):
-
Use the AI Chatbot to generate a PERT chart by describing project phases
-
Convert seamlessly to a Gantt view for stakeholder reporting
-
-
Standard AI Diagram Generator:
In Visual Paradigm Desktop or Online, use the AI Diagram Generator to type what you need and get accurate diagrams without manual drawing.
Key Benefits of AI Integration
-
Automated Scheduling: AI identifies task sequences and dependencies from plain English
-
Time Savings: Reduces planning time from hours to minutes
-
Dynamic Synchronization: Visual edits instantly reflect in task data and vice-versa via the Gantt Chart Builder
“As an Agile PM, I value tools that reduce administrative overhead. Generating a first-draft roadmap via AI prompt, then refining it collaboratively with my team, keeps us focused on outcomes—not chart formatting.”
Conclusion: Choosing the Right Tool for Your Agile Context
Gantt and PERT charts aren’t mutually exclusive—they’re complementary lenses for project visualization. For Agile teams, the goal isn’t rigid adherence to one format, but selecting the right representation for the right audience and purpose.
-
Use PERT for deep-dive dependency mapping during planning or risk assessment
-
Use Gantt for timeline communication, stakeholder alignment, and progress tracking
-
Leverage AI-powered tools to accelerate creation, enable format conversion, and maintain agility
The most effective project managers don’t just know how to draw these charts—they know when to use them, who needs to see them, and how to keep them living documents that evolve with the project. In an Agile world, flexibility isn’t a compromise; it’s the strategy.
References
- Gantt Chart Software Guide: Comprehensive overview of Gantt chart features, use cases, and software recommendations for project managers.
- Practical Guide to Gantt Charts: Step-by-step guidance on creating and applying Gantt charts in real-world project scenarios.
- Gantt Chart for Project Managers: Role-specific insights on leveraging Gantt charts for planning, tracking, and team coordination.
- Using Visual Paradigm’s AI Development Plan Generator: Tutorial on generating AI-powered project timelines and development plans from text prompts.
- AI Diagram Generation Feature: Overview of Visual Paradigm’s AI tool for instant diagram creation from natural language descriptions.
- AI Development Plan Generator Tutorial: Detailed walkthrough of using AI to automate project planning and visualization.
- AI-Powered Project Planning Guide: Best practices for integrating AI-generated plans into Agile workflows.
- Gantt Chart for Project Managers (CN): Chinese-language resource on Gantt chart applications for project leadership.
- Visual Paradigm AI PERT Chart Generator: Review of AI capabilities for generating and converting PERT charts in Visual Paradigm.
- Free Gantt Chart Builder Release: Announcement and feature overview of Visual Paradigm’s free, AI-enhanced Gantt chart tool.
- Visual Paradigm AI Ecosystem Guide: Comprehensive guide to Visual Paradigm’s integrated AI tools for diagramming and project visualization.
- Free Gantt Chart Builder Updates: Latest enhancements and usage tips for the free Gantt chart builder tool.
