Staring at a database schema that resembles a tangled ball of yarn is a familiar experience for any data architect or developer. You open your modeling tool, and instead of a clean, logical map of your data, you see crossing lines, ambiguous labels, and entities that seem to defy logic. This visual chaos is not just an aesthetic issue; it is a symptom of structural debt that will eventually cost you time, money, and system stability. 📉
When an Entity Relationship Diagram (ERD) appears broken, it usually means the underlying design principles have been compromised. It is not merely about drawing lines between boxes; it is about defining the truth of your data relationships. A broken diagram leads to a broken database, which results in slow queries, data inconsistency, and difficult maintenance cycles. The good news is that these issues are not unsolvable. By returning to foundational, timeless principles of database theory, you can restore order to the chaos. This guide will walk you through diagnosing the symptoms, understanding the root causes, and applying proven strategies to repair your schema. 🛡️
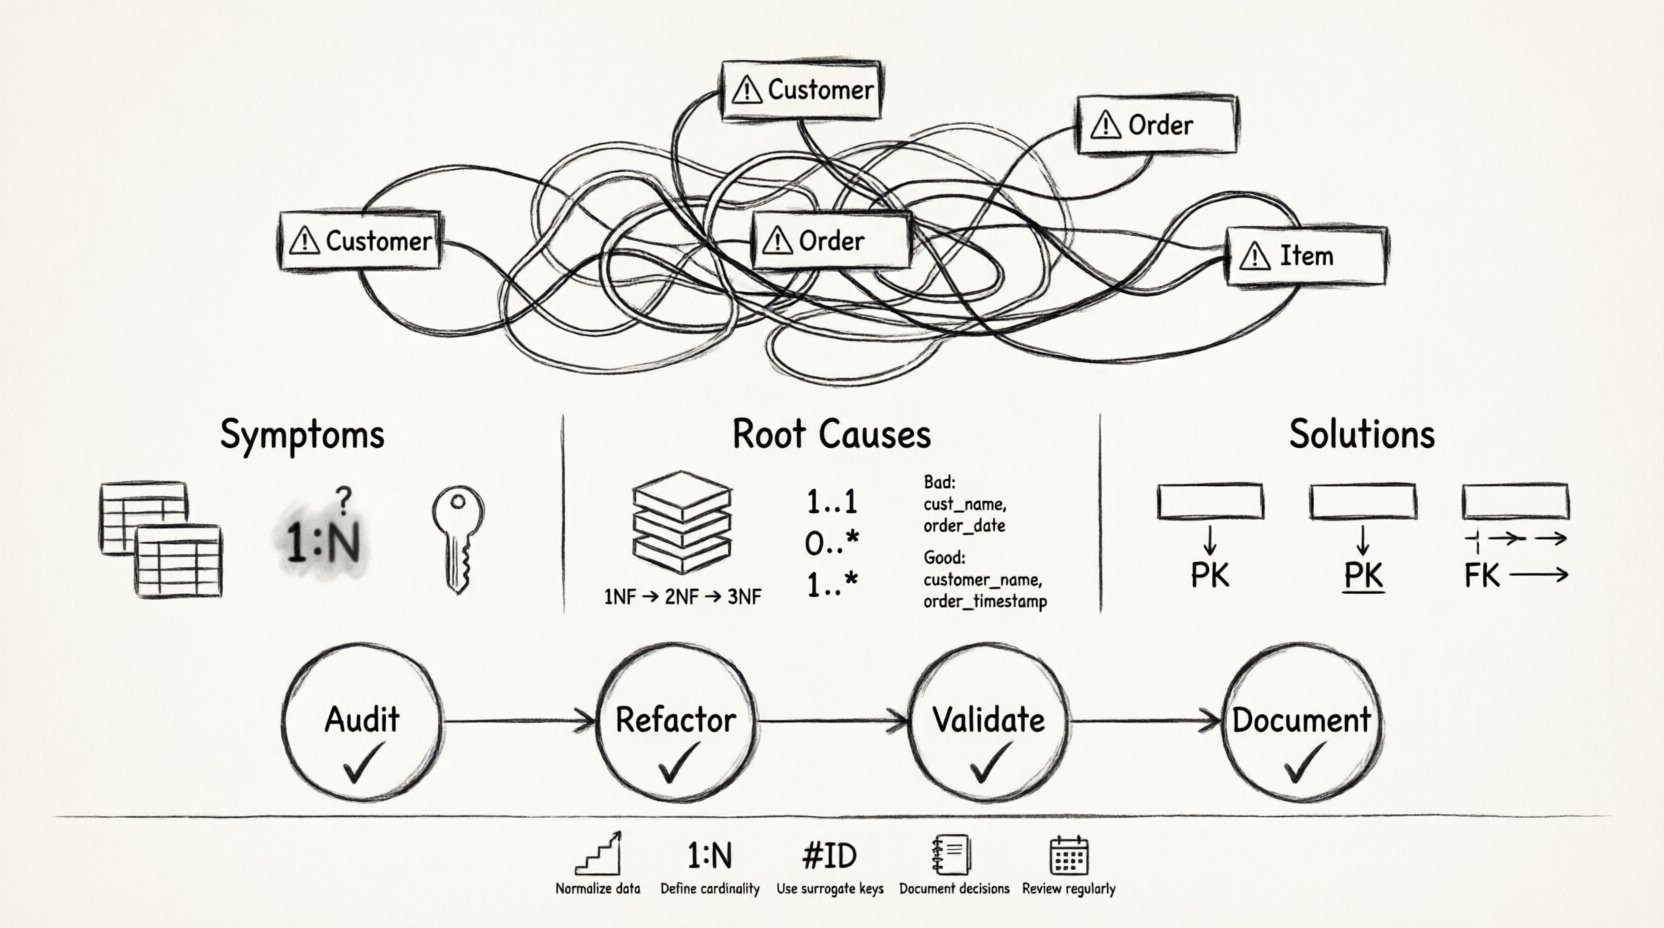
🔍 Identifying the Symptoms of a Broken ERD
Before you can fix a problem, you must recognize its signs. A database model that looks “broken” often exhibits specific visual and logical red flags. These indicators suggest that the abstraction layer between your business requirements and the physical storage is flawed.
- Spaghetti Relationships: Lines cross over each other uncontrollably, making it impossible to trace the flow of data without getting lost. This often happens when foreign keys are placed arbitrarily without a clear hierarchy.
- Redundant Entities: You see two or more tables that store the same information under slightly different names. For example, having both
CustomerandClienttables without a clear distinction in their data scope. - Ambiguous Cardinality: The lines connecting entities do not clearly define the relationship type. Is it one-to-one? One-to-many? Many-to-many? If the crow’s foot notation is missing or inconsistent, the intent is unclear.
- Circular Dependencies: Entity A relates to Entity B, which relates to Entity C, which loops back to Entity A. While sometimes necessary, these often indicate a failure to normalize data properly.
- Missing Keys: Primary keys are absent, or foreign keys do not link to a defined parent. This breaks the referential integrity of the system.
- Non-Atomic Values: A single column contains multiple pieces of information, such as “First Name” and “Last Name” combined in one field, or a list of tags stored as a comma-separated string.
When you see these signs, the diagram is signaling that the data model is not ready for implementation. Proceeding with such a diagram invites technical debt. The following sections detail how to address these issues using established theoretical frameworks.
🧠 The Root Causes: Why Models Fail
Understanding why an ERD looks broken requires looking at the design process. Most failures stem from prioritizing speed over structure. When developers rush to build features, they often create tables that fit the immediate query needs but ignore the broader data integrity requirements.
1. Ignoring Normalization
Normalization is the process of organizing data to reduce redundancy and improve data integrity. Skipping this step is the most common reason for a broken schema. Without normalization, you risk data anomalies where updating a piece of information in one place does not update it everywhere.
- First Normal Form (1NF): Ensures every column contains atomic values. If a column holds a list, the table is not in 1NF.
- Second Normal Form (2NF): Requires the table to be in 1NF and ensures all non-key attributes are fully dependent on the primary key. This prevents partial dependencies.
- Third Normal Form (3NF): Requires the table to be in 2NF and ensures no transitive dependencies exist. In other words, non-key attributes should not depend on other non-key attributes.
If your diagram shows columns that depend on other columns rather than just the key, you have a normalization issue. This often results in tables that are too wide and difficult to query efficiently.
2. Misunderstanding Cardinality
Cardinality defines the numerical relationship between instances of entities. Misinterpreting this leads to inefficient joins and complex queries. A common mistake is modeling a Many-to-Many relationship as a direct link between two tables. In reality, a direct link cannot exist in standard relational structures without an intermediate table.
- One-to-One: Used for security or specialized data. Rarely used in high-traffic systems.
- One-to-Many: The most common relationship. One parent can have multiple children.
- Many-to-Many: Requires a junction table. Failing to create this bridge causes data integrity issues.
3. Poor Naming Conventions
A diagram that is hard to read is a diagram that will be misused. Inconsistent naming, such as mixing snake_case and camelCase, or using generic names like Table1 and Table2, creates cognitive load. When developers cannot immediately understand what a table represents, they make assumptions that lead to bugs.
🛠️ Timeless Principles for Restoration
To fix a broken diagram, you do not need new tools or trendy methodologies. You need to apply the core principles of relational theory. These principles have stood the test of time because they address the fundamental nature of data.
1. Atomicity and Granularity
The principle of atomicity dictates that each cell in your table should hold a single value. If you have a column for “Address,” it should ideally be split into “Street,” “City,” “State,” and “Zip.” This allows you to query specific parts of the address without parsing strings. This granularity makes your data more flexible for future reporting needs.
2. Unique Identification
Every entity must have a unique identifier. This is your Primary Key. Without it, you cannot reliably reference a specific row. If your diagram lacks explicit primary keys, or if you are relying on natural keys that might change (like an email address), you are risking data drift. Use surrogate keys (like auto-incrementing integers or UUIDs) for internal stability.
3. Referential Integrity
This principle ensures that links between tables remain valid. If you delete a customer, what happens to their orders? The diagram should reflect the rules of deletion and updating. This is often managed through Foreign Keys. A broken diagram often has foreign keys that point to nothing or allow null values where they should not.
4. Separation of Concerns
Keep distinct concepts in separate tables. Do not mix user profile data with authentication credentials in the same table unless there is a compelling reason. This separation allows you to scale and secure different parts of the data independently.
📊 Common Pitfalls vs. Standard Solutions
The table below summarizes common errors found in poorly designed ERDs and the standard corrective actions based on database theory.
| Pitfall | Visual Symptom | Root Cause | Standard Solution |
|---|---|---|---|
| Redundant Data | Same info in multiple tables | Violation of 3NF | Normalize tables; remove duplicate columns |
| Missing Relationships | Isolated boxes | Assumed logic | Define explicit Foreign Keys |
| Many-to-Many Direct Link | Line connecting two many-sided entities | Relational constraint | Introduce a Junction Table |
| Compound Keys | Multiple columns as Primary Key | Complexity risk | Use a Surrogate Key where possible |
| Null-heavy Columns | Many empty cells in a column | Optional data mismanagement | Create separate tables for optional attributes |
| Spaghetti Logic | Crossing lines everywhere | Refactoring skipped | Group entities by domain; re-draw logically |
🔄 The Repair Process: A Step-by-Step Framework
Fixing a broken diagram is a systematic process. It requires patience and a willingness to restructure. Do not rush to apply fixes; understand the current state first.
Step 1: The Audit
Begin by documenting what exists. Do not assume you know what every table does. Create a data dictionary that describes the purpose of each column and the expected data type. This forces you to confront the reality of the schema. Look for columns that store lists, dates stored as strings, or IDs that are mixed with text.
- List all entities and their attributes.
- Identify all existing relationships and their types.
- Highlight any data that seems redundant or ambiguous.
Step 2: The Refactor
Once you have the audit, apply the normalization rules. Break wide tables into narrower ones. Move repeating groups into separate tables. Ensure every table has a primary key. If you find a Many-to-Many relationship without a bridge table, create one. This step is where the heavy lifting happens.
Consider the business rules. If a user can have multiple addresses, the Address table must exist independently of the User table. The relationship is managed through a linking table or a foreign key, depending on the specific constraint.
Step 3: The Validation
After refactoring, validate the new design. Check for circular dependencies. Ensure that deleting a record does not orphan other records unless intended. Verify that all foreign keys point to valid primary keys. Run a sanity check against your original requirements to ensure the new structure still supports the necessary queries.
Step 4: Documentation
A diagram that is not documented is a diagram that will break again. Add comments to your entities. Explain the business logic behind complex relationships. This ensures that future developers understand the “why” behind the structure, not just the “what”.
🛡️ Maintaining Long-Term Integrity
Even a perfectly designed diagram can degrade over time. As requirements change, new features are added, and shortcuts are taken. To maintain a healthy schema, you need a maintenance strategy.
- Regular Reviews: Schedule periodic reviews of your schema. Look for signs of entropy. Are new tables following the same naming conventions? Are relationships consistent?
- Version Control: Treat your ERD like code. Store it in a version control system. This allows you to track changes over time and revert if a change introduces errors.
- Constraint Enforcement: Use database constraints to enforce the rules you defined in the diagram. Do not rely solely on application logic to prevent invalid data. If the diagram says a field is mandatory, the database should enforce that.
- Community Standards: Adopt a standard for your organization. Whether it is naming conventions, key types, or relationship notations, consistency reduces friction.
📝 Summary of Best Practices
Building a robust database schema is about discipline. It is about resisting the urge to make things work quickly at the expense of long-term stability. By adhering to these principles, you ensure that your data model remains flexible and reliable.
- Always normalize your data to reduce redundancy.
- Define clear cardinality for every relationship.
- Use surrogate keys for stability.
- Document your decisions and business rules.
- Review your schema regularly to prevent decay.
A broken ER diagram is not a failure; it is an opportunity to refine your understanding of your data. By applying these timeless principles, you transform a chaotic mess into a structured asset that supports your application’s growth. The effort you invest in cleaning up your diagram today saves countless hours of debugging tomorrow. 🚀
Remember, the goal is not just to draw lines between boxes. The goal is to create a map that accurately reflects the reality of your business data. When your diagram aligns with the principles of integrity, normalization, and clarity, your database becomes a foundation you can build upon with confidence.

