Constructing a robust Business Motivation Model (BMM) is a foundational step for any organization seeking clarity in its strategic direction. However, a model that sits idle on a shelf offers no value. To ensure that the model remains a living, breathing asset that guides decision-making, it requires rigorous health monitoring. This guide outlines the critical metrics necessary to evaluate the vitality of your Business Motivation Model.
Organizations often invest significant resources into defining goals, objectives, and strategic influences. Without measuring the efficacy of these definitions, the initiative risks becoming an administrative exercise rather than a strategic driver. By tracking specific indicators, stakeholders can identify misalignments, resource drains, and opportunities for optimization. This document provides a technical framework for assessing the health of your BMM without relying on proprietary software, focusing instead on the structural integrity and operational relevance of the model itself.
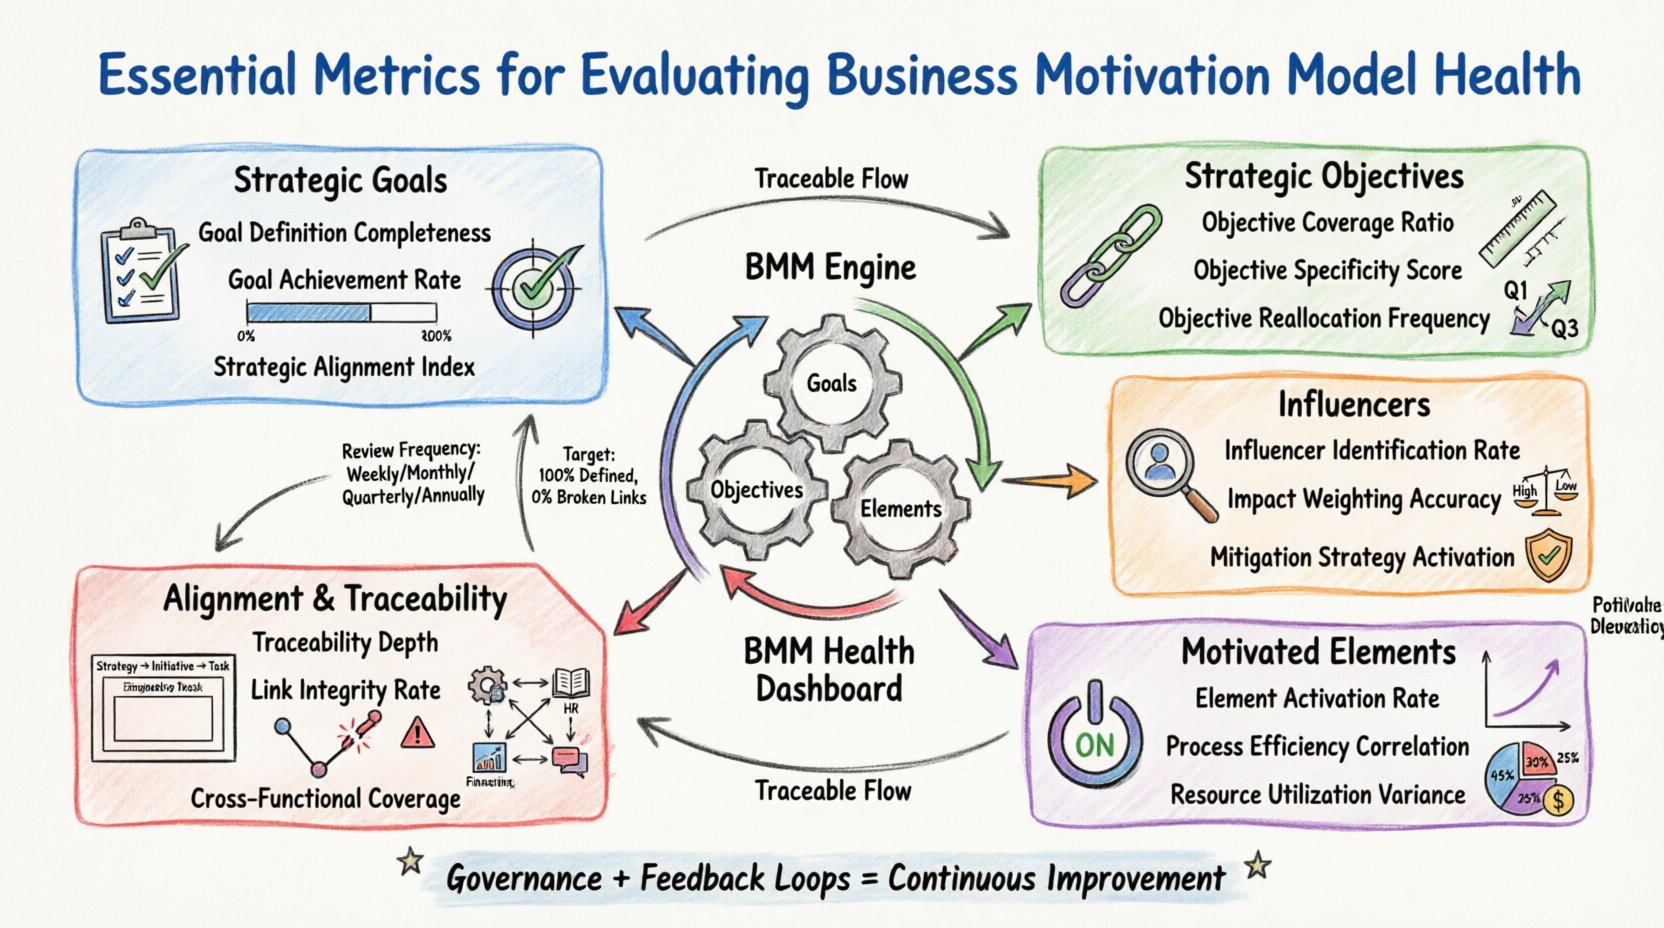
🔍 Understanding the Core Components
Before measuring health, one must understand the anatomy of the model. The Business Motivation Model typically structures business intent into several key layers:
- Strategic Goals: High-level aspirations that define the desired future state.
- Strategic Objectives: Specific, measurable targets that support the overarching goals.
- Influencers: Internal or external factors that impact the ability to achieve goals.
- Motivated Elements: The specific processes, resources, or policies activated to meet the objectives.
A healthy model demonstrates clear traceability from the top-level goal down to the tactical execution. If a motivated element cannot be traced back to a strategic objective, it represents waste. If an objective has no corresponding goal, it represents a distraction. The metrics below are designed to quantify these relationships and their performance.
🎯 Metrics for Strategic Goals
Strategic Goals represent the pinnacle of your motivation model. They define where the organization wants to go. Evaluating their health involves looking at their definition quality, their current status, and their contribution to the broader enterprise.
1. Goal Definition Completeness
A goal is only useful if it is understood. This metric measures the percentage of goals that contain all required attributes, such as a clear statement of intent, a defined timeframe, and a responsible owner.
- Why it matters: Ambiguous goals lead to divergent interpretations across departments.
- Target: 100% of active goals should be fully defined.
- Risk: Low scores indicate a need for governance intervention to standardize goal articulation.
2. Goal Achievement Rate
This metric tracks the actual completion status of goals against their planned timelines. It is not merely about whether a goal was marked “complete,” but whether the intended outcome was realized.
- Calculation: (Number of Achieved Goals / Total Number of Active Goals) × 100.
- Frequency: Quarterly review.
- Interpretation: A rate significantly below 50% suggests goals are too ambitious or resources are insufficient. A rate near 100% may indicate that goals are set too low to drive meaningful change.
3. Strategic Alignment Index
This measures how well the set of goals aligns with the organization’s mission and vision. It involves a qualitative assessment of whether the goals collectively support the core purpose of the enterprise.
- Method: Expert review panel scores goals on a scale of 1 to 5 based on mission fit.
- Outcome: Identifies goals that are “orphaned” from the main strategic vision.
📈 Metrics for Strategic Objectives
Objectives break down goals into manageable steps. They are the bridge between vision and execution. The health of the model depends heavily on whether these objectives are driving the necessary actions.
4. Objective Coverage Ratio
This metric ensures that every strategic goal is supported by at least one measurable objective. It prevents goals from becoming mere slogans without actionable paths.
- Calculation: Number of Goals with Linked Objectives / Total Number of Goals.
- Target: 1.0 (or 100%).
- Implication: Any goal without an objective requires immediate review or decommissioning.
5. Objective Specificity Score
Objectives must be measurable. This metric evaluates the presence of quantitative or qualitative indicators for each objective. It checks if the objective states “increase sales” (vague) versus “increase sales by 10%” (specific).
- Scoring: Points awarded for clear metrics, deadlines, and owners.
- Benefit: High specificity scores lead to better performance tracking and accountability.
6. Objective Reallocation Frequency
This tracks how often objectives are moved from one goal to another or reassigned to different owners. High volatility indicates instability in the strategic plan.
- Monitoring: Track changes per quarter.
- Analysis: Frequent movement suggests the initial planning was inaccurate or external conditions are shifting rapidly.
🔄 Metrics for Influencers
Influencers are the forces that push or pull against your goals. They can be regulatory changes, market shifts, or internal culture. Ignoring them renders the model brittle.
7. Influencer Identification Rate
This measures the percentage of known high-impact influencers that have been formally documented within the model. Missing influencers create blind spots.
- Focus: External regulatory bodies, competitor actions, and internal resource constraints.
- Target: 100% of known critical influencers.
8. Influence Impact Weighting Accuracy
Once an influencer is identified, it must be weighted (e.g., High, Medium, Low). This metric checks the accuracy of these weights over time by comparing predicted impact against actual outcomes.
- Process: Post-event analysis of how the influencer actually affected the goal.
- Adjustment: Refine weighting criteria based on historical data.
9. Mitigation Strategy Activation
For negative influencers, there must be a defined mitigation strategy. This metric counts how often these strategies are triggered and their success rate.
- Key Question: When a threat materialized, was there a pre-planned response?
- Health Indicator: High activation with low success indicates poor contingency planning.
⚙️ Metrics for Motivated Elements
Motivated elements are the actual work—processes, resources, and policies. They are the engine room of the model. If these are not performing, the model is theoretical.
10. Element Activation Rate
This measures the percentage of motivated elements that are actively being executed or utilized. A high number of inactive elements suggests redundancy.
- Calculation: Active Elements / Total Defined Elements.
- Action: Review inactive elements for potential removal to reduce complexity.
11. Process Efficiency Correlation
This links the performance of motivated processes directly to the achievement of the objectives they support. It answers whether the work being done is actually moving the needle.
- Method: Correlation analysis between process KPIs and objective KPIs.
- Insight: Identifies processes that consume resources but do not contribute to strategic goals.
12. Resource Utilization Variance
This tracks the variance between planned resource allocation for motivated elements and actual usage. Significant variance can indicate scope creep or resource bottlenecks.
- Focus: Budget, time, and human capital.
- Benefit: Ensures that the model remains realistic regarding available capacity.
🔗 Metrics for Alignment and Traceability
The true power of the Business Motivation Model lies in the connections between its parts. These metrics measure the strength of the links that hold the structure together.
13. Traceability Depth
This metric counts the average number of steps from a Strategic Goal down to a Motivated Element. Deeper traceability ensures granular alignment.
- Example: Goal → Objective → Process → Task.
- Goal: Maximize depth to ensure every task has a strategic purpose.
14. Link Integrity Rate
This checks for broken or orphaned links within the model. A broken link occurs when a child element points to a parent that no longer exists.
- Scan: Automated or manual validation of relationships.
- Target: 0% broken links.
15. Cross-Functional Coverage
This evaluates whether the motivated elements span across different departments or units as intended. It prevents siloed strategies where one department works against another.
- Analysis: Map elements to organizational units.
- Indicator: High coverage indicates holistic organizational alignment.
📋 Summary of Key Metrics
The following table provides a quick reference for the metrics discussed above, categorizing them by their focus area and recommended review frequency.
| Metric Name | Category | Key Indicator | Review Frequency |
|---|---|---|---|
| Goal Definition Completeness | Strategic Goals | % Defined Attributes | Quarterly |
| Goal Achievement Rate | Strategic Goals | Completion % | Quarterly |
| Strategic Alignment Index | Strategic Goals | Mission Fit Score | Annually |
| Objective Coverage Ratio | Strategic Objectives | Links per Goal | Monthly |
| Objective Specificity Score | Strategic Objectives | Measurability Rating | Monthly |
| Influencer Identification Rate | Influencers | % Known Factors | Quarterly |
| Element Activation Rate | Motivated Elements | Active vs Total | Monthly |
| Link Integrity Rate | Alignment | Broken Links Count | Weekly |
| Traceability Depth | Alignment | Average Steps | Annually |
🛡️ Governance and Maintenance
Metrics are useless without a governance framework to act on them. Establishing a BMM Governance Board is essential to ensure these health indicators are monitored and acted upon. This board should include representatives from strategy, operations, and IT.
Roles and Responsibilities
- Model Owner: Responsible for the overall structure and integrity of the BMM.
- Data Stewards: Ensure data accuracy for metrics like achievement rates.
- Strategy Leads: Interpret the metrics to adjust strategic direction.
Feedback Loops
Health metrics should feed directly into the planning cycle. If the Goal Achievement Rate drops, the next planning cycle must address the root causes. This creates a continuous improvement loop.
- Review Cadence: Schedule formal reviews of all metrics during quarterly business reviews.
- Alert Thresholds: Define thresholds for specific metrics (e.g., if Link Integrity Rate drops below 95%, trigger an audit).
- Documentation: Record all changes made to the model based on metric analysis.
⚠️ Common Pitfalls in Metric Selection
When implementing this framework, organizations often fall into specific traps that undermine the value of the metrics.
1. Vanity Metrics
Avoid tracking numbers that look good but do not reflect true health. For example, counting the number of goals defined is less valuable than tracking the number of goals achieved. Focus on outcome-based metrics rather than output-based metrics.
2. Analysis Paralysis
Collecting too many metrics can overwhelm the team. Select the top 5 to 10 metrics that drive the most critical decisions. Regularly prune the list if a metric stops providing actionable insights.
3. Ignoring Context
A metric score in isolation can be misleading. A low Goal Achievement Rate might be negative, or it might be positive if the market conditions have shifted drastically. Always analyze metrics in the context of external influencers.
4. Static Measurement
The BMM is dynamic. Metrics that worked last year may not apply this year. Review the relevance of each metric annually to ensure it aligns with current organizational priorities.
🚀 Final Observations
Evaluating the health of a Business Motivation Model is not a one-time event. It is an ongoing discipline that requires commitment and precision. By implementing the metrics outlined in this guide, organizations can move from a static document to a dynamic management tool.
The primary benefit of this approach is visibility. You gain a clear view of how well your strategy translates into action. You can identify where resources are wasted and where opportunities are missed. This clarity enables better decision-making and fosters a culture of accountability.
Start by auditing your current model against these metrics. Identify the gaps. Prioritize the fixes that offer the highest return on investment. Over time, the model will become a trusted partner in your strategic journey, guiding the enterprise through complexity with confidence.
Remember that the goal is not perfection, but continuous improvement. Regular monitoring, honest assessment, and proactive governance will ensure your Business Motivation Model remains a robust asset capable of withstanding market shifts and driving sustainable growth.

