When a database architecture designed on paper performs flawlessly in a sandbox but collapses under real-world traffic, the disconnect often lies between the visual model and the runtime reality. An Entity Relationship Diagram (ERD) is a blueprint, not a living engine. However, when developers refer to an “ERD failing under load,” they are typically describing a schema design derived from that diagram that cannot sustain production demands. This guide addresses the structural, logical, and performance bottlenecks that cause relational models to struggle when data volume and concurrency spike.
Diagnosing these issues requires a deep understanding of how data relationships translate into I/O operations, lock contention, and memory usage. We will explore the friction points where design choices collide with hardware limitations and traffic patterns. By identifying the specific symptoms of structural failure, you can refactor your data model to support scale without compromising data integrity.
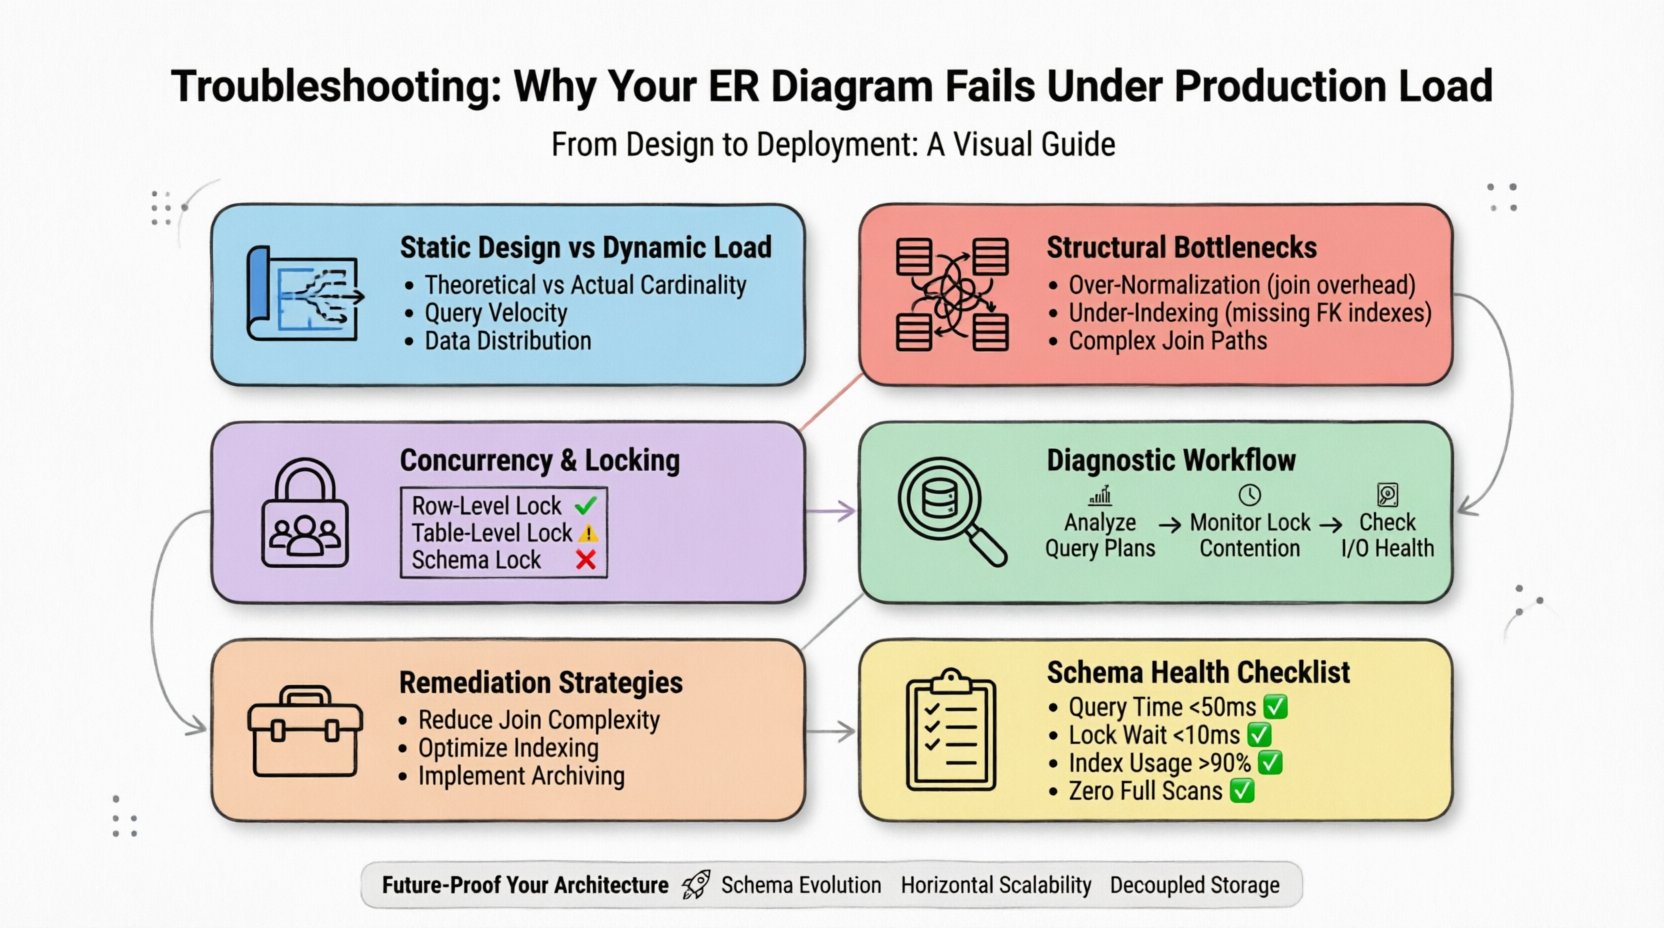
1. The Gap Between Static Design and Dynamic Load ⚡
An ER diagram represents potential relationships and data types. It does not account for the velocity of writes, the distribution of reads, or the physical storage constraints of the underlying engine. A model that looks balanced on a whiteboard often hides inefficiencies that only manifest when millions of rows are queried simultaneously.
- Theoretical vs. Actual Cardinality: Diagrams assume one-to-one or one-to-many relationships. In production, these often become many-to-many with complex join paths that exhaust CPU resources.
- Query Velocity: A schema might handle a few thousand reads per second but choke on thousands per millisecond due to lock granularity.
- Data Distribution: Hotspots occur when data is not evenly distributed across storage nodes, leading to uneven load balancing.
To diagnose effectively, you must stop treating the schema as a static artifact. It is a dynamic resource that must be monitored as closely as the server itself.
2. Common Structural Bottlenecks 📉
The most frequent cause of performance degradation is the relationship structure itself. How tables connect determines how the engine traverses the data. Complex joins are the primary culprit for slow query execution times.
2.1 Over-Normalization Risks
While normalization reduces redundancy, excessive normalization increases the number of joins required to retrieve a single dataset. In high-load scenarios, every join is a potential point of failure.
- Join Overhead: Each join operation requires the database to match rows from two tables. If these tables are large and lack proper indexing, the engine performs a full table scan.
- Transaction Depth: Deeply normalized schemas often require long-running transactions to fetch related data, holding locks for extended periods.
- Cache Efficiency: Normalized data is fragmented across multiple pages, reducing the effectiveness of buffer pool caching.
2.2 Under-Indexing and Access Paths
A well-structured ERD implies access patterns. If the diagram does not align with the actual query workload, the database engine cannot find the fastest path to the data.
- Foreign Key Indexes: Foreign keys often lack indexes, causing performance drops when deleting or updating parent records.
- Composite Key Order: The order of columns in a composite index matters. If queries filter on the second column first, the index may be ignored.
- Missing Selective Indexes: Without indexes on high-cardinality columns, the engine scans entire tables to find specific values.
3. Concurrency and Locking Mechanisms 🔒
When load increases, concurrency becomes the primary constraint. Multiple users attempting to modify the same data create contention. If the schema design does not account for lock granularity, the system deadlocks or times out.
| Lock Type | Impact on Load | Typical Symptom |
|---|---|---|
| Row-Level Lock | Minimal impact, high concurrency | Low latency, high throughput |
| Table-Level Lock | High impact, blocks other users | Timeout errors, hanging queries |
| Schema Lock | Blocks all access during DDL | System-wide outage during maintenance |
3.1 Deadlocks and Race Conditions
Deadlocks occur when two transactions wait for each other to release resources. This is often caused by inconsistent locking orders in the application logic interacting with the schema.
- Transaction Isolation Levels: Higher isolation levels (like Serializable) provide safety but reduce concurrency significantly.
- Lock Escalation: If a transaction locks too many rows, the engine may escalate to a table lock, blocking all other operations.
- Long Transactions: Operations that hold locks for seconds instead of milliseconds create bottlenecks for the entire queue.
4. Data Volume and Partitioning Strategies 📊
As data grows, the physical limits of the storage layer become apparent. A schema that works for 10,000 rows may fail catastrophically with 100 million rows. Partitioning is the method used to divide large tables into smaller, manageable pieces.
- Vertical Partitioning: Moving rarely accessed columns to a separate table reduces the size of the primary table, improving cache hit rates for hot data.
- Horizontal Partitioning: Splitting rows across multiple physical segments (sharding) distributes the load across multiple storage nodes.
- Time-Based Partitioning: For transactional data, partitioning by date allows the engine to drop old partitions instantly without locking the whole table.
5. Diagnostic Workflow for Production Failures 🔍
When the system slows down, you need a systematic approach to identify the root cause. Random optimization often wastes resources. Follow this workflow to pinpoint the issue.
5.1 Analyze Query Execution Plans
The execution plan reveals how the database engine intends to retrieve data. Look for specific indicators of inefficiency.
- Full Table Scans: Indicates a missing index or a query that requests too much data.
- Key Lookups: Suggests the engine must jump between the index and the table data repeatedly, increasing I/O.
- Sort Operations: Sorting large result sets consumes significant memory and CPU.
5.2 Monitor Lock Contention
Use system tools to monitor wait events. High wait times on locks indicate that the schema cannot support the current concurrency level.
- Wait Time Metrics: Track the duration transactions spend waiting for resources.
- Deadlock Graphs: Review historical data to see which queries caused conflicts.
- Lock Wait Queue: Monitor the number of transactions waiting for the same resource.
5.3 Check I/O Subsystem Health
Even with a perfect schema, slow storage will cause failures. Ensure the underlying infrastructure matches the data access patterns.
- Throughput Limits: Check if the storage device is saturated with read/write operations.
- Latency Spikes: Inconsistent response times from the storage layer often indicate hardware degradation.
- Buffer Pool Efficiency: If the database spends more time reading from disk than memory, the schema or data volume is too large for the cache.
6. Remediation Strategies for Schema Optimization 🛠️
Once the bottleneck is identified, apply targeted changes. Refactoring a production schema requires caution to avoid data loss or downtime.
6.1 Reducing Join Complexity
Simplify the relationships that cause the most friction. This often involves denormalizing specific areas of the model.
- Materialized Views: Pre-calculate complex joins and store the result in a separate table for fast retrieval.
- Computed Columns: Store derived data directly in the table to avoid calculation at query time.
- Read-Replica Routing: Send read-heavy queries to a replica that holds a denormalized copy of the data.
6.2 Optimizing Indexing Strategy
Indexes are the most effective tool for speeding up lookups, but they have a cost on write operations.
- Filtered Indexes: Create indexes only on subsets of data that are frequently queried.
- Covering Indexes: Include all columns needed for a query in the index to avoid accessing the main table.
- Index Maintenance: Regularly rebuild or reorganize indexes to prevent fragmentation caused by frequent updates.
6.3 Implementing Soft Deletes and Archiving
Active data is faster to query than historical data. Moving old data out of the primary table improves performance.
- Archive Tables: Move records older than a certain threshold to a separate, colder storage layer.
- Soft Deletes: Mark records as deleted without removing them, keeping the table structure stable while logically hiding data.
- Data Retention Policies: Automate the purging of unnecessary data to prevent uncontrolled growth.
7. Evaluation Checklist for Schema Health ✅
Before deploying changes, verify your model against these criteria to ensure it can handle production stress.
| Criteria | Pass Condition | Fail Condition |
|---|---|---|
| Average Query Time | < 50ms | > 500ms |
| Lock Wait Time | < 10ms | > 100ms |
| Index Usage | > 90% | < 50% |
| Full Table Scans | Zero | Frequent |
Regularly auditing your data model against these metrics ensures that the design evolves alongside your business needs. A static schema will eventually become a liability. Continuous monitoring and incremental adjustments are the only way to maintain reliability.
8. Understanding Query Patterns and Workloads 📈
Performance is not just about the schema; it is about how that schema is used. Understanding the workload profile is essential for tuning the model.
- OLTP vs. OLAP: Online Transaction Processing (OLTP) requires fast, small writes. Online Analytical Processing (OLAP) requires fast, large reads. A schema optimized for one often struggles with the other.
- Write Heavy Patterns: If your application writes frequently, prioritize index efficiency and minimize locking on writes.
- Read Heavy Patterns: If your application reads frequently, prioritize caching strategies and read-replicas.
9. The Role of Application Logic in Database Performance 💻
Often, the fault lies not in the database, but in how the application interacts with it. N+1 query problems are a classic example of application-level inefficiency that manifests as database failure.
- Bulk Operations: Sending thousands of individual insert statements is slower than a single batch operation.
- Lazy Loading: Fetching data in small chunks can generate excessive round-trips to the database.
- Connection Pooling: Inefficient management of database connections can exhaust the available resources during peak load.
Optimizing the application layer reduces the pressure on the schema, allowing the database to function within its designed parameters.
10. Future-Proofing Your Data Architecture 🚀
Designing for the future requires anticipating growth. While you cannot predict exact traffic numbers, you can design for elasticity.
- Schema Evolution: Use migration strategies that allow for non-disruptive changes to the data model.
- Horizontal Scalability: Design tables to support sharding from the beginning.
- Decoupled Storage: Separate the storage layer from the compute layer to scale them independently.
By adhering to these principles, you build a foundation that withstands the pressures of production. The goal is not just to fix current issues, but to create a resilient system capable of adapting to future challenges.
11. Summary of Key Diagnostic Steps 📝
To recap, diagnosing production load failures involves a multi-layered approach.
- Review the ERD: Check for overly complex relationships and missing indexes.
- Analyze Queries: Look for full table scans and inefficient join paths.
- Monitor Locks: Identify contention points that cause timeouts.
- Check Hardware: Ensure storage and memory are not bottlenecks.
- Optimize Schema: Apply partitioning and indexing strategies.
- Refactor Application: Reduce the number of database calls and optimize transaction handling.
Following this structured approach ensures that you address the root cause rather than the symptoms. Performance tuning is an iterative process that requires patience and precision.
12. Final Thoughts on Schema Resilience 🧠
A robust data model is the backbone of any high-performance application. It requires constant attention and a willingness to adapt as traffic patterns change. By understanding the nuances of relationships, indexing, and concurrency, you can prevent the common pitfalls that lead to production failures.
Remember that the diagram is a tool, not the system. The true test of your design happens in the live environment. Keep your monitoring tight, your indexes clean, and your transactions short. With these practices in place, your data architecture will serve as a reliable foundation for your business growth.
Stay vigilant. Monitor your metrics. Refactor when necessary. Your system will thank you.

