Entity-Relationship Diagrams serve as the foundational blueprint for database architecture. They translate abstract business requirements into a structured visual language that developers and stakeholders can interpret. Understanding the specific symbols used within these diagrams is critical for ensuring data integrity, scalability, and clarity. Without a standardized approach to notation, ambiguity can lead to costly errors during the implementation phase. This guide explores the core components, relationships, and notations that define a professional ER diagram.
🏗️ Understanding the Core Entities
At the heart of every ER diagram lies the concept of an entity. An entity represents a real-world object or concept that requires storage within a database system. In visual modeling, entities are typically represented by rectangles. The text inside the rectangle denotes the name of the entity, usually in plural form to indicate a collection of objects.
- Rectangle Shape: This is the universal symbol for an entity. Whether it represents a customer, a product, or a transaction, the rectangle provides the boundary for the data object.
- Entity Naming: Names should be singular or plural but consistent. For example, using “Customer” for all instances avoids confusion with “Customers” mixed in the same model.
- Primary Key: Every entity must have a unique identifier. In notation, this is often shown by underlining the attribute name within the entity box or by specifying it as the key in the legend.
- Weak Entities: Some entities depend entirely on another entity for their existence. These are often drawn with a double-lined rectangle to indicate their dependency.
When designing the schema, it is essential to distinguish between strong and weak entities early in the process. A strong entity has its own primary key, while a weak entity relies on the primary key of the parent entity plus a partial key to achieve uniqueness. This distinction impacts how foreign keys are established in the physical database.
🏷️ Attributes and Their Representation
Attributes define the properties or characteristics of an entity. They hold the actual data values. While the rectangle represents the entity, attributes are displayed differently depending on the notation standard being used. Some styles use ovals connected by lines, while others list them inside the entity rectangle.
🔹 Attribute Types
- Simple Attributes: These are atomic values that cannot be divided further. Examples include an ID number or an age.
- Composite Attributes: These can be divided into sub-parts. A name can be split into First Name and Last Name. A date can be split into Day, Month, and Year.
- Multi-valued Attributes: An entity may have more than one value for a single attribute. For instance, a person has multiple phone numbers. In diagrams, these are often represented by a double ellipse or a list icon.
- Derived Attributes: These values are calculated from other attributes. An example is Age, which can be derived from the Date of Birth. These are usually shown with a dashed line or a dashed ellipse.
Choosing the right representation for attributes affects readability. Listing them inside the rectangle keeps the diagram compact, which is beneficial for high-level logical models. Using external ovals is often preferred for detailed physical designs where attribute types and constraints need to be more visible.
🔗 Mapping Relationships
Relationships define how entities interact with one another. They describe the association between two or more entities. In the diagram, this connection is visually represented by lines or diamonds, depending on the notation style.
🔹 Relationship Symbols
- Diamond Shape: In traditional Chen notation, relationships are depicted as diamonds. The entity names connect to the diamond, which describes the verb or action linking them.
- Lines: In modern Crow’s Foot notation, lines connect the entities directly. The relationship name is often placed near the line or in the middle of the connection.
- Cardinality: Lines are annotated with specific markers to show how many instances of one entity relate to instances of another. This is the most critical aspect of relationship modeling.
Understanding the direction and type of relationship is vital. A relationship can be one-to-one, one-to-many, or many-to-many. Misrepresenting these can lead to database redundancy or orphaned records. For example, if a library tracks books and members, a book can be borrowed by many members, but a member can borrow many books. This is a many-to-many relationship.
📏 Cardinality Notations Explained
Cardinality dictates the specific constraints on the relationship. It answers the question: “How many instances of Entity A can relate to one instance of Entity B?” There are three main notations used globally to express this.
🔹 Crow’s Foot Notation
This is the most widely used standard in modern database design. It uses specific symbols at the end of the relationship line to indicate quantity.
- Single Line: Represents “one”.
- Crow’s Foot (Three prongs): Represents “many”.
- Circle: Represents “zero” (optional).
- Circle + Line: Represents “zero or one”.
- Circle + Crow’s Foot: Represents “zero or many”.
🔹 Chen Notation
Chen notation uses numbers inside the relationship line to denote cardinality. It is often used in academic settings or older documentation.
- (1,1): Exactly one.
- (0,1): Zero or one.
- (0,N): Zero or many.
- (1,N): One or many.
🔹 UML Multiplicity
The Unified Modeling Language uses a similar syntax to Chen but integrates more deeply with software engineering diagrams.
- 1: Exactly one.
- 0..1: Zero or one.
- 0..*: Zero or more.
- 1..*: One or more.
| Notation | Symbol Meaning | Best Use Case |
|---|---|---|
| Crow’s Foot | Visual hooks and lines | Modern SQL Database Design |
| Chen | Numbers in boxes | Academic / Theoretical Models |
| UML | Range syntax | Software Architecture & Systems |
Selecting the correct notation depends on the team’s familiarity and the tooling available. Crow’s Foot is generally preferred for its visual intuitiveness regarding database constraints.
⚠️ Weak Entities and Identifying Relationships
Not all entities are created equal. Some exist only because another entity exists. These are called weak entities. In an ER diagram, they require special symbols to indicate this dependency.
- Double Rectangle: Indicates a weak entity. The entity cannot be uniquely identified without the parent entity.
- Double Diamond: Indicates an identifying relationship. This relationship is mandatory for the weak entity to exist.
- Dashed Line: Sometimes used to connect the weak entity to its owner, emphasizing the dependency.
For example, consider a “Dependent” entity in an “Employee” system. A dependent does not exist in the database unless an employee is associated with them. The primary key of the Dependent table would include the Employee ID. This structural relationship must be clearly marked to prevent data loss during schema generation.
🛠️ Best Practices for Diagram Clarity
A well-constructed diagram reduces cognitive load for engineers and stakeholders. Following established conventions ensures that the model remains understandable over time.
- Consistency is Key: Use the same notation style throughout the entire project. Mixing Crow’s Foot with Chen notation creates confusion.
- Naming Conventions: Ensure table and column names follow a standard naming convention, such as camelCase or snake_case, to match the diagram labels.
- Grouping: If the diagram is large, group related entities together using boxes or grouping containers. This helps in managing complexity.
- Hierarchy: Place higher-level entities at the top or center, with subordinate entities branching out. This mimics the flow of data relationships.
- Documentation: Add a legend or key if non-standard symbols are used. Explain any abbreviations used in the diagram.
🚫 Common Errors to Avoid
Even experienced modelers make mistakes. Being aware of common pitfalls helps maintain the integrity of the design.
- Missing Primary Keys: Every table must have a primary key. Omitting this leads to duplicate records and data instability.
- Many-to-Many Without Junction: Directly connecting two entities with a many-to-many relationship without an intermediate junction table is invalid in relational databases. You must resolve this into two one-to-many relationships.
- Circular Dependencies: Avoid creating loops where Entity A references B, B references C, and C references A. This complicates query performance and data loading.
- Over-Normalization: While normalization is good, splitting tables too aggressively can degrade performance. Ensure the diagram balances integrity with usability.
- Ambiguous Labels: Avoid vague terms like “Info” or “Details”. Be specific. Use “CustomerAddress” instead of “Info”.
🔄 Evolution of the Schema
Database designs are rarely static. Business requirements change, and the diagram must evolve with them. When updating an ER diagram, track the changes to the symbols and relationships.
- Version Control: Maintain versions of the diagram to track how relationships have shifted over time.
- Impact Analysis: Before removing a symbol or relationship, analyze the downstream effects on existing data and applications.
- Communication: Ensure all stakeholders review changes to new symbols or altered cardinalities. A change in a relationship definition can break application logic.
🔍 Technical Implementation Considerations
Translating the visual diagram into actual database code requires attention to detail. The symbols on the page dictate the SQL commands generated.
- Foreign Keys: Lines in the diagram that represent relationships become Foreign Key constraints in the database. The direction of the line determines which table holds the key.
- Indexes: Primary keys automatically create indexes. Secondary keys or unique constraints identified in the diagram should be explicitly defined.
- Data Types: While the diagram shows structure, the underlying data types (VARCHAR, INT, DATE) must be defined to match the attribute types.
- Constraints: Nullability is often indicated by the circle symbol in cardinality notation. Ensure the physical database enforces these constraints.
By adhering to these principles, the transition from design to implementation becomes smoother. The diagram serves not just as documentation, but as an executable specification for the database engine.
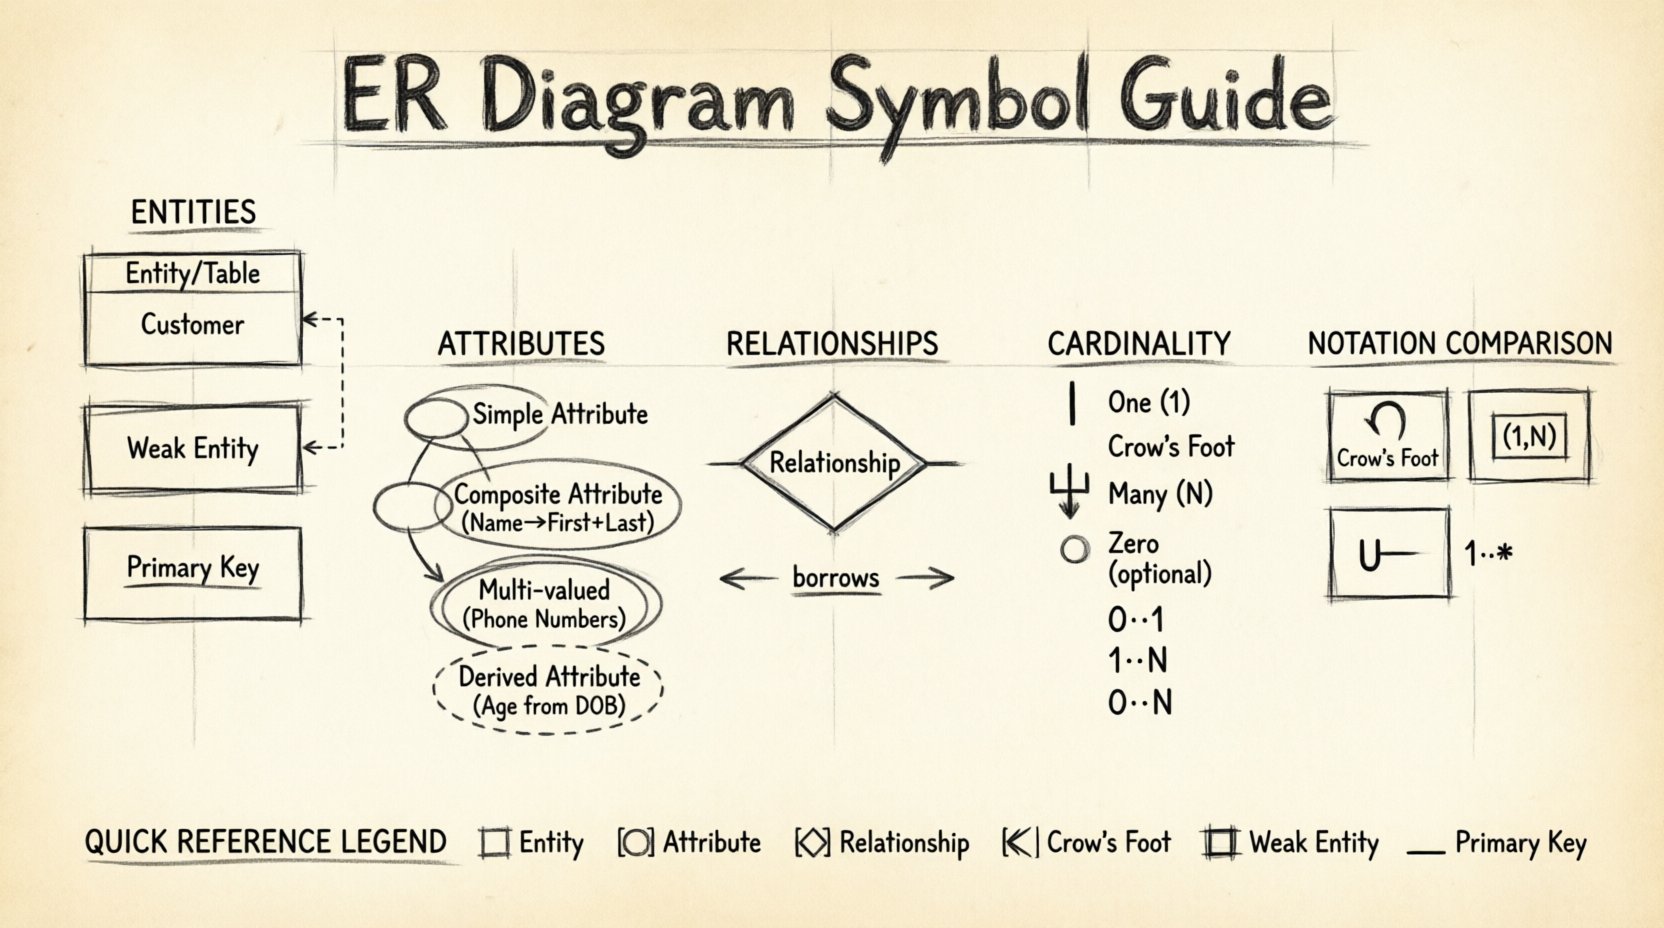
📝 Summary of Symbol Meanings
To assist in quick reference, here is a summary of the most critical symbols used in professional modeling.
| Symbol | Meaning | Context |
|---|---|---|
| Rectangle | Entity / Table | Core Object |
| Oval | Attribute / Column | Data Point |
| Diamond | Relationship | Connection Type |
| Line | Association | Link between Entities |
| Crow’s Foot | Many | Cardinality |
| Double Rectangle | Weak Entity | Dependency |
| Underline | Primary Key | Uniqueness |
Mastery of these components allows for the creation of robust data models. It ensures that the logic behind the data is preserved and that the system can grow without structural failure. Focus on clarity, precision, and adherence to standards to produce diagrams that stand the test of time.
🧭 Final Thoughts on Model Integrity
The integrity of a database relies heavily on the accuracy of its design. Every symbol carries weight in defining how data flows and relates. By understanding the nuances of entities, attributes, and relationships, you ensure that the final system meets business needs without technical debt. Regular reviews of the diagram against the actual implementation help maintain this alignment. Continuous learning of notation standards keeps the design process efficient and effective.
Investing time in learning these symbols pays off during the development and maintenance phases. It reduces miscommunication between business analysts and developers. It also simplifies troubleshooting when data inconsistencies arise. A clear diagram is a powerful tool for any data professional.

