Business processes are the backbone of any organization. They define how work moves from one stage to another, how data flows, and where value is created. For a Business Analyst, the ability to visualize these processes is not just a nice-to-have skill; it is a fundamental requirement for success. This is where Business Process Model and Notation (BPMN) becomes essential.
BPMN provides a standardized way to represent business processes graphically. It bridges the gap between technical teams and business stakeholders. When you translate abstract requirements into concrete diagrams, you eliminate ambiguity. You create a shared language that ensures everyone understands the workflow, the exceptions, and the decision points.
This guide explores how to leverage BPMN effectively. We will move beyond simple definitions and dive into the practical application of turning raw requirements into clear, actionable diagrams. You will learn the core symbols, the modeling process, and the best practices that lead to high-quality documentation.
Understanding BPMN Fundamentals 🧩
BPMN is a global standard maintained by the Object Management Group (OMG). It is designed to be understood by all participants in a business process, from business managers to technical developers. Unlike proprietary modeling languages, BPMN uses a specific set of symbols that carry semantic meaning.
The primary goal of BPMN is to represent a process from start to finish. It captures:
- Who performs the activities (roles or participants).
- What actions are taken (tasks or subprocesses).
- When events trigger the flow (start, intermediate, or end events).
- How decisions are made (gateways).
- How data moves between steps (message flows or data associations).
For a Business Analyst, mastering this notation means reducing the back-and-forth communication. A well-drafted diagram speaks louder than a thousand words in a requirements document.
Why BPMN Matters for Business Analysts 📝
The role of a Business Analyst involves eliciting, analyzing, and documenting requirements. Often, these requirements are scattered across emails, spreadsheets, and meeting notes. BPMN consolidates this information into a single source of truth.
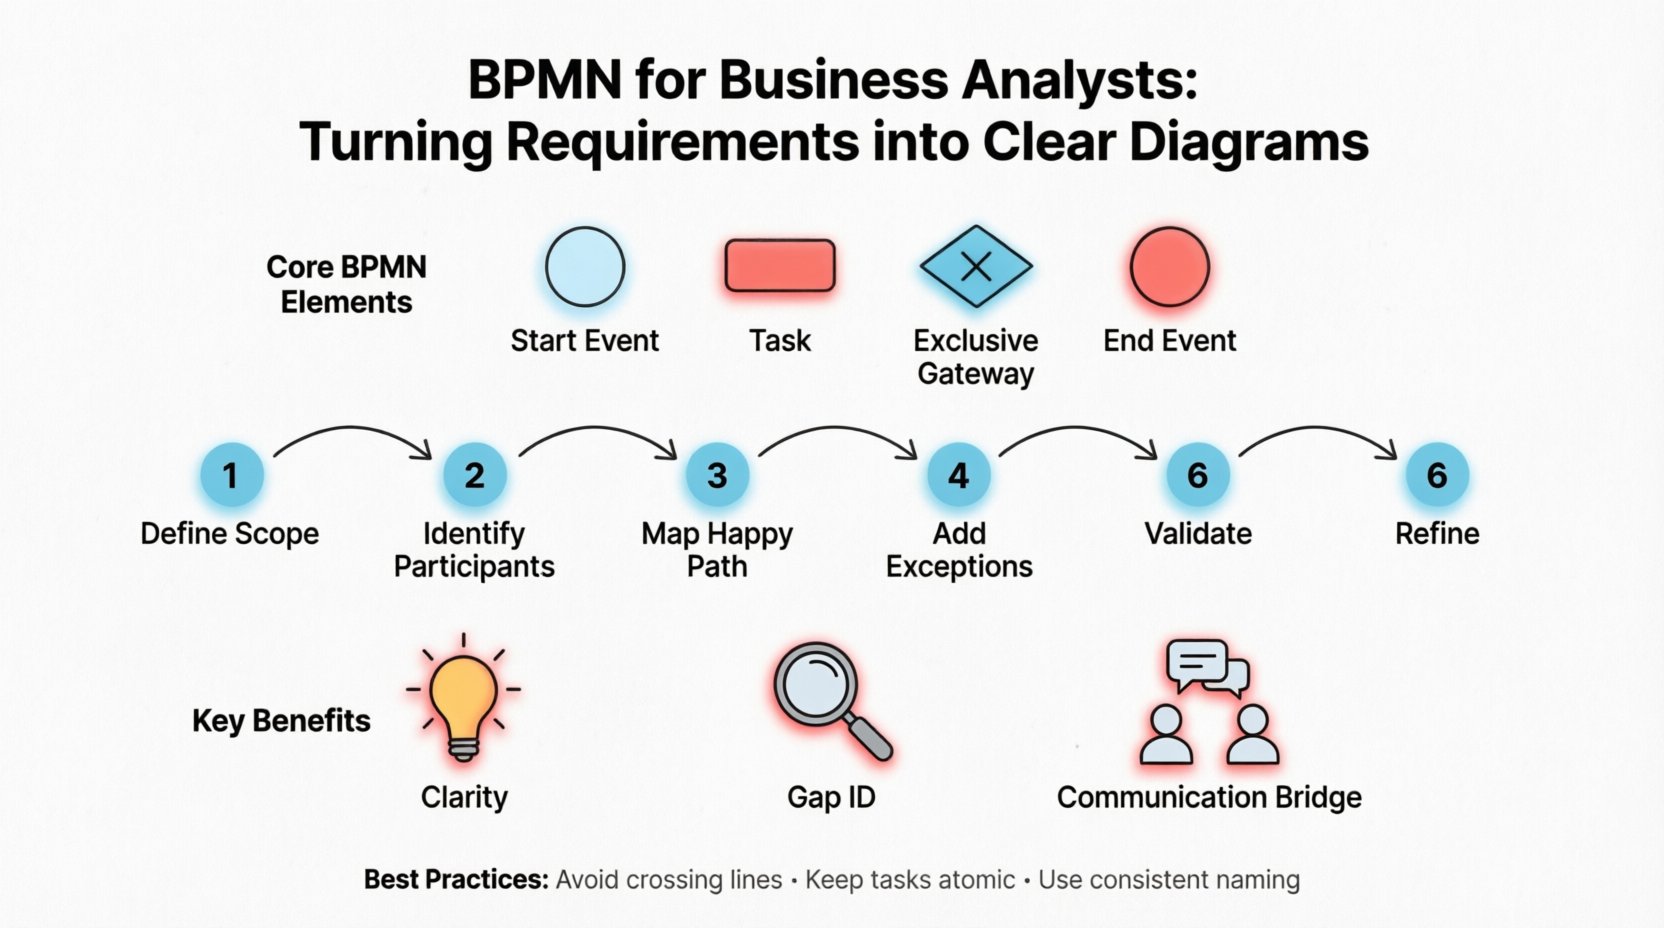
1. Clarity and Consistency
Without a standard notation, one team might draw a process differently than another. BPMN enforces consistency. When you see a diamond shape, you know it represents a gateway. When you see a circle, it is an event. This consistency reduces cognitive load for stakeholders reviewing the documentation.
2. Gap Identification
When you map a process visually, gaps become obvious. You might realize a step is missing, or a decision point has no clear outcome. Diagramming forces you to follow the flow logically. If the arrow stops, the process stops. This helps in identifying missing requirements early in the project lifecycle.
3. Communication Bridge
Technical teams need to know how to build the solution. Business users need to know what the solution will do. BPMN sits in the middle. It is technical enough to inform system design but abstract enough for business users to validate the logic.
Core Elements of BPMN 2.0 🏗️
To build accurate diagrams, you must understand the building blocks. BPMN 2.0 organizes these elements into four main categories: Flow Objects, Connecting Objects, Swimlanes, and Artifacts.
Flow Objects
These are the active elements that drive the process forward.
- Events: Represent something that happens. They are depicted as circles. They have a start, intermediate, or end state.
- Activities: Represent work that is performed. They are shown as rounded rectangles. This includes tasks, sub-processes, and call activities.
- Gateways: Represent decisions or branching paths. They are shown as diamonds. They control the flow of the process based on conditions.
Connecting Objects
These connect the flow objects to show the sequence.
- Sequence Flow: Solid line showing the order of activities. Used within the same process.
- Message Flow: Dashed line showing communication between different participants or pools.
- Association: Dotted line connecting data or annotations to elements.
Swimlanes
These organize activities by who performs them. There are two main types:
- Pools: Represent distinct participants or organizations. A pool usually contains its own process boundaries.
- Lanes: Divide a pool to show different roles, departments, or systems within the same participant.
Common BPMN Symbols Table 📋
| Category | Symbol Name | Visual Shape | Usage Context |
|---|---|---|---|
| Event | Start Event | Thin Circle | Triggers the process (e.g., Receipt of Order). |
| Event | End Event | Thick Circle | Terminates the process (e.g., Order Shipped). |
| Event | Intermediate Event | Medium Circle | Occurs during the process (e.g., Waiting for Email). |
| Activity | Task | Rounded Rectangle | Single unit of work with no internal flow. |
| Activity | Sub-Process | Rounded Rectangle with + sign | Complex task that can be expanded into detail. |
| Gateway | Exclusive Gateway (XOR) | Diamond with X | One path out of many based on a condition. |
| Gateway | Inclusive Gateway (OR) | Diamond with O | One or more paths can be taken. |
| Gateway | Parallel Gateway (AND) | Diamond with + | All paths are executed simultaneously. |
Turning Requirements into Diagrams: A Step-by-Step Guide 🚀
Creating a BPMN diagram is not about drawing shapes randomly. It is a structured engineering task. Follow this workflow to ensure your diagrams accurately reflect business needs.
Step 1: Define the Scope
Before drawing, determine the boundaries. What starts the process? What ends it? What is out of scope? If you try to model the entire organization in one diagram, it will become unreadable. Keep the scope focused on a specific business goal or transaction.
Step 2: Identify Participants
Who is involved? List all roles, departments, or external systems. Create a Pool for the main process and Lanes for each participant. Ensure every lane has a clear purpose. If a lane has no activities, consider removing it.
Step 3: Map the Happy Path
Start by modeling the ideal scenario. This is the “Happy Path.” How does the process flow if everything goes according to plan? Connect the Start Event to the End Event using the most logical sequence of tasks. This provides a skeleton for your diagram.
Step 4: Add Exceptions and Variations
Real-world processes are rarely perfect. Add the “Unhappy Paths.” Use Gateways to represent decision points where the flow might diverge. For example, if a credit check fails, the process moves to a rejection task. If it passes, it moves to fulfillment.
Step 5: Validate with Stakeholders
Share the draft diagram with business users. Walk them through the logic. Ask them to verify the sequence. Did you miss a step? Is the decision logic correct? This validation phase is critical for ensuring accuracy.
Step 6: Refine and Annotate
Add text annotations where necessary. BPMN symbols are intuitive, but complex business rules might need explanation. Use Data Objects to show what information is passed between tasks. Ensure labels are concise but descriptive.
Deep Dive: Events and Gateways 🎲
These are the most critical elements for controlling logic. Misusing them leads to confusing diagrams.
Event Types
Events are not just dots on a line; they carry meaning based on their border style and icon.
- Start Events: Must be simple (plain circle) or have a specific trigger icon (like a clock for time or an envelope for a message).
- Intermediate Events: Used to model waiting or interruptions. A Timer event indicates a wait for a specific time. A Message event indicates waiting for input.
- End Events: The process must end here. You can have multiple End Events to represent different outcomes (Success vs. Failure).
Gateway Logic
Gateways determine how many paths are taken.
- Exclusive Gateway: Use this when only one path is valid. For example, if a form is valid, go to approval. If invalid, go to correction. Only one arrow leaves this gateway.
- Inclusive Gateway: Use this when multiple conditions can be true at once. For example, a customer might qualify for both a discount and free shipping. Both paths activate.
- Parallel Gateway: Use this to split work into concurrent tasks. For example, sending an email and updating the database can happen at the same time. All outgoing paths are taken.
Best Practices for Clean Modeling 🧹
A diagram that is hard to read is a failed model. Adhere to these guidelines to maintain quality.
1. Avoid Crossing Lines
Sequence flows should not cross each other unnecessarily. Use connectors or arrange tasks to keep the flow horizontal or vertical. Crossing lines create visual noise and confusion.
2. Keep Tasks Atomic
Do not lump too much work into a single task. If a task takes too long or has internal logic, break it down. A task labeled “Process Order” is vague. “Validate Stock,” “Calculate Price,” and “Generate Invoice” are clearer.
3. Use Sub-Processes for Complexity
If a section of the process is complex, encapsulate it in a Sub-Process. This keeps the main diagram clean. Stakeholders can drill down into the sub-process later if they need details.
4. Consistent Naming
Use a consistent naming convention. Start tasks with verbs. Use nouns for data objects. Ensure the language matches the business vocabulary, not the technical database schema.
5. Limit Pool and Lane Count
Too many pools or lanes make the diagram horizontal and difficult to print or view. If you have many participants, consider splitting the process into multiple diagrams linked by message flows.
Common Pitfalls to Avoid ⚠️
Even experienced analysts make mistakes. Be aware of these common traps.
- Orphaned Gateways: Ensure every gateway has a path. An Exclusive Gateway without a default path is an error. If no condition matches, the process halts.
- Dead Ends: Every path must eventually reach an End Event. If a line ends in the middle of the diagram, the process is incomplete.
- Confusing Message and Sequence Flow: Do not use Message Flow (dashed) within a single process. It is only for communication between Pools. Use Sequence Flow (solid) for internal steps.
- Over-Engineering: Do not model every single click a user makes. Focus on the business process, not the UI interaction details unless relevant to the logic.
- Lack of Context: A diagram without a legend or title is useless. Always include a title that describes the process name and version.
Collaboration and Review Processes 🤝
Modeling is rarely a solitary activity. It requires feedback loops.
Workshops
Conduct workshops with stakeholders to build the diagram together. This ensures buy-in and immediate clarification of doubts. Use a whiteboard or a collaborative modeling tool to facilitate this.
Version Control
Processes change. Requirements change. Maintain version numbers on your diagrams. Document what changed between version 1.0 and 1.1. This history is vital for audits and future reference.
Traceability
Link diagram elements to specific requirements. If a task exists because of Requirement ID 101, tag it. This allows you to trace how the business need is fulfilled in the process design.
Integration with Agile and Development 🛠️
Modern development often uses Agile methodologies. BPMN fits well here, but it requires adaptation.
User Stories
Use BPMN to visualize the acceptance criteria within a User Story. The diagram shows the flow that must be tested. It complements the text description.
Automation Readiness
BPMN is often used to trigger automation engines. If your diagrams are clean and semantic, they can sometimes be converted directly into executable code. Ensure your tasks are clearly defined as human work or system work to facilitate this transition.
Iterative Modeling
In Agile, you do not need to model the entire year’s roadmap. Model the next sprint’s requirements. Keep the diagrams lightweight. Focus on the immediate deliverable and evolve the process over time.
Ensuring Quality Assurance in Diagrams 🔍
Before finalizing a diagram, run a quality check.
- Syntax Check: Are all shapes valid BPMN elements?
- Logic Check: Can the process reach an End Event from every Start Event?
- Completeness Check: Are all decision paths covered?
- Readability Check: Is the flow easy to follow without explanation?
Automated tools can help with syntax checks, but human judgment is required for logic. Have a peer review the diagram. A fresh pair of eyes often catches errors the creator missed.
The Future of Process Modeling 🌐
As technology evolves, so does process modeling. The integration of AI into BPMN tools is emerging. These tools can suggest process improvements based on historical data. They can also simulate process performance before implementation.
For Business Analysts, this means the focus shifts from drawing to analyzing. You will spend less time creating the diagram and more time interpreting what the diagram reveals about efficiency and bottlenecks.
However, the core skill remains the same. Understanding the logic, the flow, and the business value. Technology changes, but the need for clear communication does not.
Final Thoughts on Process Excellence 💡
BPMN is a powerful tool in the Business Analyst’s toolkit. It transforms abstract ideas into concrete models. When used correctly, it reduces errors, speeds up development, and aligns business and IT.
Remember that a diagram is a living document. It requires maintenance and updates as the business changes. By following best practices and avoiding common pitfalls, you ensure your diagrams remain valuable assets for the organization.
Start with the basics. Master the symbols. Practice on real scenarios. Over time, you will find that turning requirements into clear diagrams becomes a natural part of your workflow. This capability sets you apart as a professional who can deliver clarity in a complex world.

