Business operations are complex webs of interactions, decisions, and data flows. To manage these effectively, organizations need a common language. Business Process Model and Notation, known as BPMN, provides that standard. It allows stakeholders to visualize, analyze, and improve workflows without relying on ambiguous descriptions. This guide explores the fundamentals of BPMN, its core symbols, and how to apply it to real-world scenarios.
What is BPMN? 💡
BPMN is a standardized graphical notation for specifying business processes. It was created by the Business Process Management Initiative (BPMI) and is now maintained by the Object Management Group (OMG). The primary goal is to bridge the gap between business analysis and technical implementation.
Before BPMN, process documentation often took the form of flowcharts. While useful, flowcharts lacked specific semantics required for automation and detailed analysis. BPMN introduces a set of rules and symbols that define exactly what each element represents. This precision ensures that anyone reading the diagram understands the process in the same way.
Why Use BPMN?
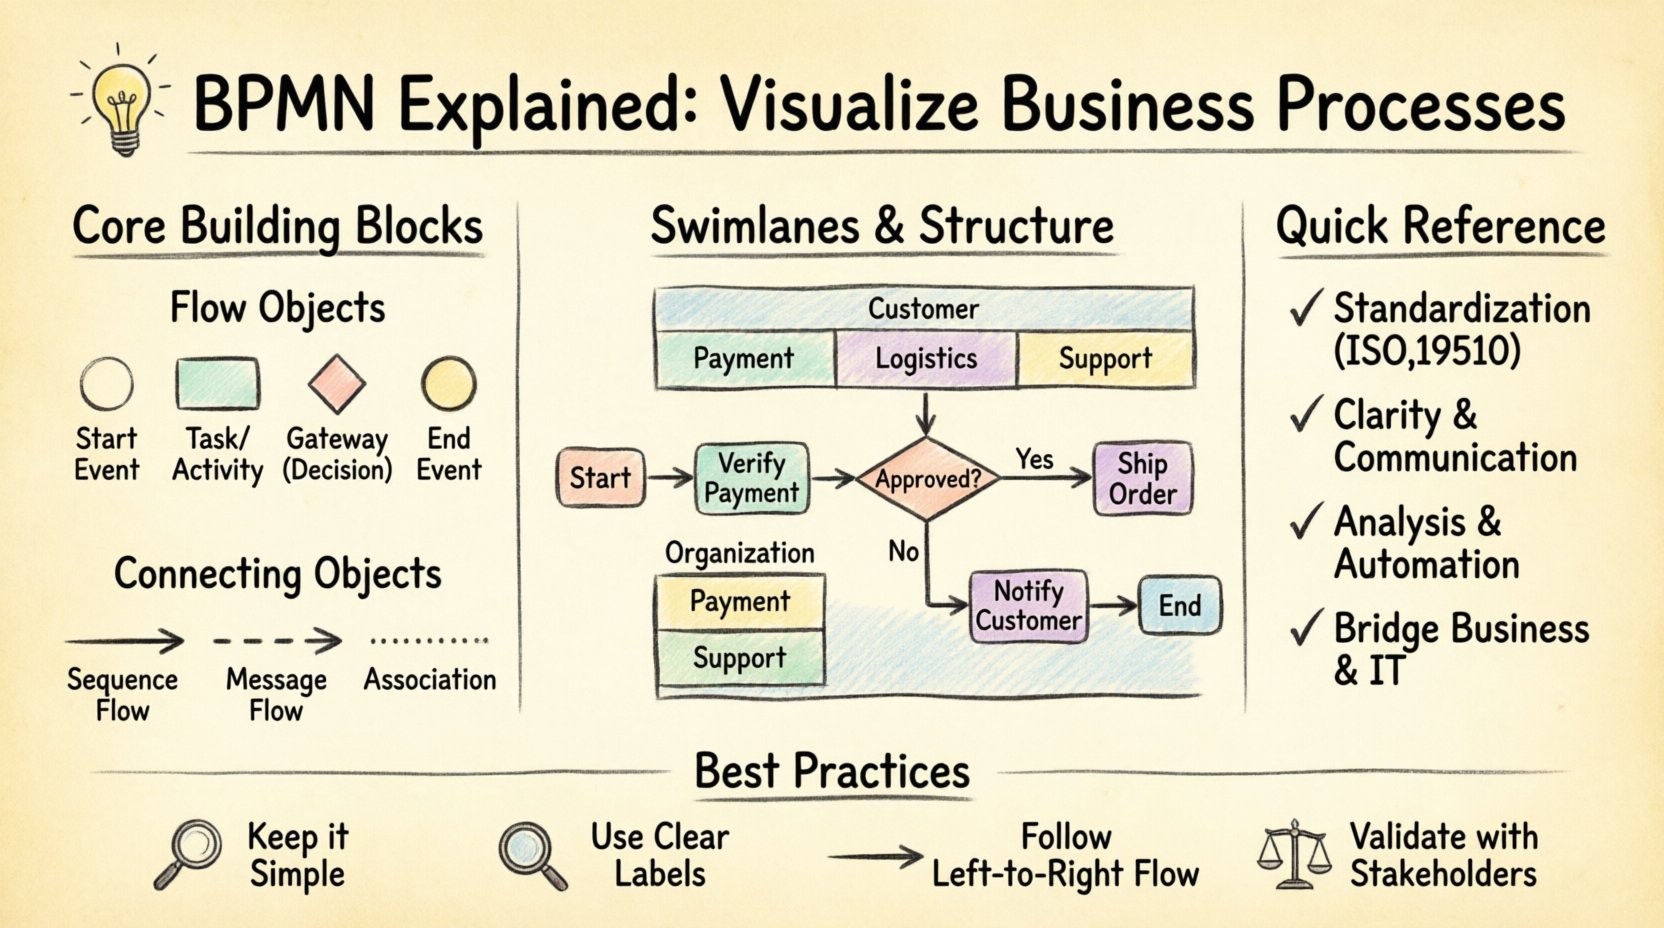
- Standardization: It is an international standard (ISO 19510), ensuring consistency across industries.
- Clarity: Visual representations reduce misinterpretation compared to text-heavy documents.
- Analysis: It supports simulation and performance analysis before implementation.
- Communication: It acts as a shared artifact between business users and IT developers.
- Automation: The notation is designed to be executable by process engines.
The Core Building Blocks of BPMN 🧱
Understanding BPMN requires familiarity with its four main categories of elements. These are Flow Objects, Connecting Objects, Swimlanes, and Artifacts.
1. Flow Objects 🔴
Flow objects form the backbone of the diagram. They define the behavior of the process. There are three types of flow objects:
- Events: Things that happen during the process. They are represented by circles.
- Activities: Work that is performed. They are represented by rounded rectangles.
- Gateways: Decisions that split or merge the flow. They are represented by diamonds.
2. Connecting Objects 🔄
These elements link flow objects together. They define the sequence or relationship between elements.
- Sequence Flow: Shows the order of activities. Typically a solid line with an arrow.
- Message Flow: Shows communication between different participants. Typically a dashed line.
- Association: Links artifacts or text to flow objects.
3. Swimlanes 🏖
Swimlanes organize activities based on who or what performs them. This adds context to the process flow.
- Pools: Represent a major participant in the process. A pool can contain lanes.
- Lanes: Sub-divisions within a pool that assign responsibility to specific roles or departments.
4. Artifacts 📄
Artifacts provide additional information without affecting the flow of the process.
- Groups: Visually group elements together.
- Data Objects: Represent information used or produced.
- Annotations: Text notes for clarification.
Deep Dive into Flow Objects 🔍
To create an accurate diagram, you must understand the specific variations of flow objects. Each symbol carries a distinct meaning.
Events – The Triggers and Outcomes ⏳
Events are the start, middle, and end of a process. They are depicted as circles. The thickness of the circle border indicates the type of event.
| Event Type | Visual Description | Meaning |
|---|---|---|
| Start Event | Thin circle | Indicates where a process begins. |
| Intermediate Event | Medium circle | Occurs during the process (e.g., waiting for a message). |
| End Event | Thick circle | Indicates the conclusion of the process. |
Events can also have specific triggers. For example, a timer event starts a process after a specific duration, while a message event waits for incoming data.
Activities – The Work Being Done 🛠
Activities represent tasks. They are rounded rectangles. There are several levels of detail for activities.
- Task: The smallest unit of work. It cannot be subdivided further in this context.
- Sub-Process: A group of activities that can be expanded into a separate diagram. This allows for abstraction.
- Call Activity: Refers to a reusable process defined elsewhere.
Gateways – Decision Points 🚦
Gateways control the divergence and convergence of the flow. They determine the path the process takes based on conditions.
- Exclusive Gateway (XOR): Only one path is taken. It is used for decisions like “Yes” or “No”.
- Inclusive Gateway (OR): One or more paths can be taken. For example, sending both email and SMS notifications.
- Parallel Gateway (AND): All paths are taken simultaneously. This is used for splitting work among parallel teams.
- Event-based Gateway: Waits for one of several events to occur, then proceeds down the triggered path.
Organizing with Pools and Lanes 🏖
Complex processes often involve multiple parties. Pools and lanes provide a structure to show who does what.
Pools
A pool represents a distinct participant. In a simple diagram, a single pool might represent the entire organization. In a collaboration diagram, multiple pools show different organizations interacting.
Lanes
Lanes divide a pool. They are used to assign responsibility. For example, a “Customer Service” lane might contain tasks related to handling inquiries, while a “Billing” lane handles payment processing.
Using lanes effectively prevents confusion about ownership. If a task is in the wrong lane, it indicates a process misalignment.
Connecting the Process 🔗
Once you have placed your objects, you must connect them. The type of line used matters significantly.
Sequence Flow
Sequence flow defines the order of activities. It is always drawn within a single pool. You cannot draw a sequence flow from one pool to another. The line is solid and has an arrowhead indicating direction.
Message Flow
Message flow represents communication between participants. It is drawn between pools or between lanes within a pool if the notation allows. It is a dashed line with an open arrow.
This distinction is crucial. Sequence flow implies a direct handoff, while message flow implies a signal or document sent across a boundary.
Best Practices for Process Modeling 📝
Creating a diagram is one thing; creating a useful one is another. Follow these guidelines to ensure your models are effective.
- Keep it Simple: Avoid clutter. If a diagram is too complex, break it down into sub-processes.
- Use Consistent Naming: Use clear, action-oriented labels for tasks (e.g., “Review Application” instead of “Review”).
- Follow the Flow: Draw from top to bottom or left to right. Avoid crossing lines where possible.
- Validate Logic: Ensure every gateway has a path for every condition. Avoid dead ends.
- Review with Stakeholders: Have the people who do the work verify the diagram. They will spot errors you might miss.
- Focus on Value: Highlight steps that add value to the customer. Identify steps that do not for elimination.
Common Mistakes to Avoid ⚠️
Even experienced modelers can make errors. Recognizing these pitfalls helps maintain diagram quality.
- Overcomplicating Gateways: Using complex logic in a gateway can make the diagram hard to read. Simplify the logic or move it to a sub-process.
- Missing End Events: Every process must have an end. If a flow leads nowhere, the diagram is incomplete.
- Confusing Message and Sequence Flow: Do not use a solid line for communication between different pools. Use a dashed line.
- Ignoring Exception Handling: Real-world processes have errors. Use error events to show what happens when things go wrong.
- Lack of Context: Do not assume the reader knows the background. Use annotations to explain specific terms or constraints.
The Role of BPMN in Workflow Optimization 📈
Visualizing processes is not just about documentation; it is about improvement. Once a process is mapped, it can be analyzed for efficiency.
Identifying Bottlenecks
A clear diagram highlights where work piles up. If a task has many incoming arrows and few outgoing ones, it may be a bottleneck. This visibility allows managers to allocate resources better.
Standardizing Operations
When every department uses the same notation, onboarding new employees becomes easier. They can understand the process flow without lengthy verbal explanations.
Supporting Automation
Modern workflow engines read BPMN diagrams. This means the visual model can often be converted directly into executable code. This reduces the gap between design and deployment.
Understanding BPMN Levels of Detail 🔍
BPMN supports different levels of abstraction. Choosing the right level depends on the audience.
Choreography
Choreography focuses on interactions between participants. It shows who sends what message to whom. It does not show internal steps of a participant.
Orchestration
Orchestration focuses on the internal logic of a single participant. It shows the sequence of tasks, decisions, and gateways within one organization.
Collaboration
Collaboration diagrams show both internal logic and external interactions. This is the most common type of BPMN diagram used for end-to-end process mapping.
Integrating Data and Business Rules 📊
Processes do not exist in a vacuum. They rely on data and rules.
Data Objects
Use data objects to show what information is needed. For example, a “Customer Form” data object might be attached to the “Review Application” task.
Business Rules
Business rules define the conditions for gateways. Instead of writing “If X then Y” in the text, use a gateway with a condition label. This keeps the diagram readable and the logic explicit.
Case Study: Order Processing 📦
Consider a standard order processing workflow. Here is how BPMN structures it.
- Start: Customer places an order (Start Event).
- Task: Verify Payment (Task in Payment Lane). Gateway: Is payment approved? (Exclusive Gateway).
- Path A: If yes, Ship Order (Task in Logistics Lane).
- Path B: If no, Notify Customer (Task in Support Lane).
- End: Order Completed (End Event).
This example shows how lanes separate responsibilities and how gateways direct the flow based on conditions. It clarifies who does what and when.
Adopting BPMN in Your Organization 🚀
Implementing BPMN requires a cultural shift. It is not just about drawing pictures; it is about thinking in processes.
Training
Ensure your team understands the symbols. Training sessions should cover the notation standards and the specific modeling rules your organization follows.
Tooling
Select a modeling tool that supports the BPMN standard. The tool should allow you to export diagrams in standard formats like XML. Avoid proprietary formats that lock you into a single vendor.
Governance
Establish a governance process for diagrams. Who approves changes? How often are diagrams reviewed? A living process model is better than a static one.
Frequently Asked Questions 💬
Is BPMN the same as a flowchart?
No. Flowcharts are generic and can vary by author. BPMN is a strict standard with defined semantics. A BPMN symbol means the same thing to everyone.
Can I use BPMN for non-business processes?
Yes. While designed for business, the notation can model IT workflows, manufacturing steps, or administrative procedures.
Do I need to learn programming to use BPMN?
No. BPMN is a visual language. However, understanding the logic helps when implementing automation.
What is BPMN 2.0?
BPMN 2.0 is the current version. It improved integration with other standards like XML and allowed for executable models. It is the industry standard today.
Final Thoughts on Process Visualization 🌟
Mastering BPMN takes time. It requires practice and patience. Start with simple processes and gradually increase complexity. The goal is not to create perfect diagrams immediately, but to create useful ones that improve understanding.
By adopting this notation, you invest in clarity. You reduce errors, improve communication, and create a foundation for continuous improvement. The visual language of BPMN empowers teams to speak a common language about how work gets done.
Remember to keep your diagrams updated. Processes change as markets and technologies evolve. A static model becomes a liability over time. Treat your process maps as living documents that guide your operations.
With the right approach, BPMN becomes more than a diagramming tool. It becomes a strategic asset that drives efficiency and transparency across the organization.

