
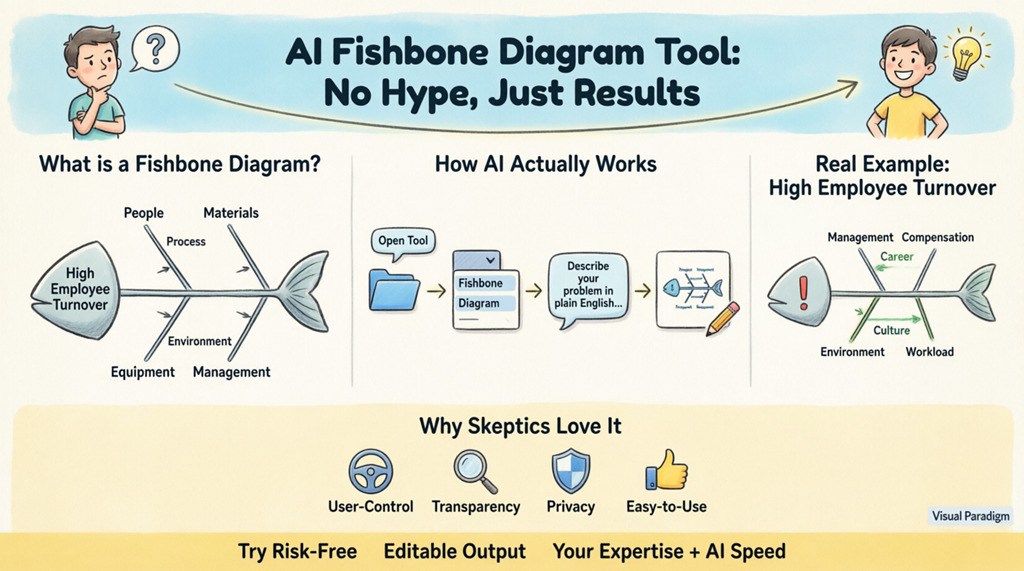
First, What Is a Fishbone Diagram? (And Why Bother?)
Before we talk about AI, let’s ground this in something familiar. A fishbone diagram (also called an Ishikawa diagram or cause and effect diagram) is a visual tool used in quality management, Six Sigma, and process improvement to identify root causes of problems. Think of it as a structured brainstorming map: the “head” is your problem (e.g., “high employee turnover”), and the “bones” are categories of causes like People, Process, Equipment, or Management. Traditionally, creating one meant whiteboards, sticky notes, and hours of manual drawing. That’s where a fishbone diagram tool with AI assistance changes the game—not by replacing your thinking, but by accelerating the tedious parts.
How the AI Fishbone Diagram Generator Actually Works (Spoiler: It’s Logical)
Let’s demystify the “AI” part. This isn’t a sentient robot guessing your needs. The AI cause and effect diagram maker uses natural language processing (NLP)—a well-established technology—to:
- Parse your text: It identifies key phrases like “Problem:”, “Causes:”, and category labels you provide.
- Map relationships: It recognizes hierarchical structures (e.g., “Management” as a main category with “Poor communication” as a sub-cause).
- Apply proven frameworks: It defaults to standard fishbone categories (like the 6 Ms: Man, Method, Machine, Material, Measurement, Environment) unless you specify otherwise.
- Generate editable output: The result is a fully customizable diagram in Visual Paradigm’s desktop or online environment—you’re always in control.
In short: you provide the expertise; the AI Ishikawa diagram generator handles the formatting. It’s like having a diligent assistant who never tires of rearranging boxes and arrows.
Step-by-Step: Watch AI Turn Your Words into a Diagram (No Tech Degree Needed)
Here’s exactly how to use the AI-powered diagramming software to create a fishbone diagram. We’ll keep it simple and transparent:
- Open the AI Diagram Generation Tool: In Visual Paradigm Desktop, navigate to Tools > AI Diagram Generation. This launches a clean dialog box—no overwhelming options.
- Choose Your Diagram Type: Select Cause and Effect Diagram from the dropdown. This tells the root cause analysis tool exactly what structure to build.
- Describe Your Problem in Plain English: This is where your expertise shines. Type something like: “Problem: High employee turnover. Possible causes: Management: Poor communication, lack of feedback. Compensation: Below-market salary, inconsistent bonuses. Career Development: No clear promotion path. Work Environment: Unhealthy office culture.” The automated fishbone diagram creator doesn’t need perfect grammar—just clear ideas.
- Generate and Review: Click OK. Within seconds, you’ll see a complete fishbone diagram. The problem sits at the head; your categories form the main bones; sub-causes branch out logically. And crucially: every element is editable. Move a branch, add a note, change a color—you’re not locked into the AI’s first draft.
This entire process takes minutes, not hours. The intelligent cause analysis tool handles the mechanical work so you can focus on analysis, discussion, and action.
Real Example: From Skeptic to Believer (High Employee Turnover Case)
Let’s walk through a concrete example. Imagine you’re a team lead investigating why talented staff keep leaving. You’re skeptical that an AI problem solving tool could capture the nuance. So you type your observations naturally:
“Problem: High employee turnover in our tech department. Suspected causes: Management: Micromanagement, infrequent feedback. Compensation: Salary below industry average, unclear bonus structure. Career Growth: No mentorship program, limited promotion paths. Work Environment: Constant overtime, poor team collaboration.”
The AI Input Process

After clicking “OK,” the AI fishbone diagram generator processes your text. Here’s what appears:
The Generated Fishbone Diagram

Notice: the diagram isn’t just pretty—it’s functional. Each branch reflects your input, organized under standard categories. You can immediately spot patterns: maybe “Poor communication” under Management connects to “Unhealthy office culture” under Work Environment. Now your team discussion has a clear visual anchor. And if the AI missed something? Just drag a new branch or edit text. The free fishbone diagram maker aspect (via Visual Paradigm’s web tools) means you can start experimenting without commitment.
Why This AI Tool Respects Your Expertise (Addressing Common Concerns)
Many professionals worry that AI tools will oversimplify complex problems or make decisions for them. Here’s how Visual Paradigm’s approach is different:
- You drive the content: The AI-powered visual modeling software doesn’t invent causes—it structures what you provide. Your domain knowledge remains central.
- Full transparency: Every element in the generated diagram is editable. Change labels, reorder branches, add data—just like any manual diagram, but faster to start.
- Low learning curve: If you can type a sentence, you can use this AI cause and effect diagram maker. No coding, no complex setup.
- Integrates with your workflow: Export diagrams to PDF, PowerPoint, or embed in reports. The tool supports over 40 diagram types (SysML, C4, ArchiMate, SWOT, PESTLE), so your fishbone analysis can connect to broader projects.
When to Use an AI Fishbone Diagram Generator (Practical Scenarios)
This automated fishbone diagram creator shines in situations where speed and clarity matter:
- Quality management teams investigating defects or process failures—turn meeting notes into actionable diagrams instantly.
- Project leaders facing delays—quickly visualize root causes across people, tools, and timelines.
- HR professionals analyzing turnover or engagement issues—structure qualitative feedback into clear categories.
- Consultants and trainers who need to demonstrate root cause analysis techniques without spending hours on diagram mechanics.
- Students and educators learning quality management frameworks—the free fishbone diagram tool lowers barriers to practice.
And if you’re still cautious? Start small. Use the root cause analysis tool for a low-stakes problem first. See how the output aligns with your thinking. Most skeptics become advocates after one successful trial.
Ready to Try It? Start Risk-Free
You don’t have to take our word for it. Visual Paradigm offers a straightforward way to test the AI fishbone diagram generator:
- Download Visual Paradigm Desktop (free trial available) to access the full AI diagram generation features.
- Or explore the browser-based free fishbone diagram maker online at Visual Paradigm Smart Board for quick, no-installation experiments.
Remember: this tool isn’t about replacing your judgment. It’s about freeing you from manual formatting so you can focus on what matters—solving the problem.
Expand Your Root Cause Analysis Toolkit
Once you’ve generated a fishbone diagram, consider pairing it with other proven techniques:
- 5 Whys analysis: Drill deeper into each cause branch. Learn how to combine fishbone diagrams with the 5 Whys technique in this practical guide.
- Pareto charts: Prioritize which causes to address first based on impact. Visual Paradigm’s platform supports seamless transitions between diagram types.
- Collaborative refinement: Share your editable diagram with teammates for input—whether using the desktop app or the online whiteboard.
Related Resources for Skeptics and Believers Alike
Explore these vetted resources to learn more about fishbone diagrams, AI-assisted analysis, and practical applications:
- AI-Powered Fishbone Diagram Generator – Uncover Root Causes in Seconds: A deep dive into how the AI Ishikawa diagram generator accelerates problem analysis.
- Fishbone Diagram and 5 Whys – Visual Paradigm: Master the art of combining visual cause mapping with iterative questioning.
- How to Create a Fishbone Diagram: A Step-by-Step Guide: A foundational tutorial for manual and AI-assisted diagram creation.
- Unraveling Complex Issues: The Power of Cause and Effect Analysis with Fishbone Diagrams: Real-world case studies showing structured problem-solving in action.
- Create Fishbone Diagrams from Text Using Visual Paradigm Smart Board: Learn how to use natural language input on a collaborative digital whiteboard—no cost, no install.
- Fishbone Analysis: Ishikawa Diagram Concepts and AI-Powered Tools: An external perspective on integrating AI with traditional quality management frameworks.
- Cause and Effect Diagram Tool – Visual Paradigm Features: Explore the full feature set of this professional root cause analysis tool.
- Free Fishbone Diagram Tool – Create Diagrams Instantly: Try a browser-based online fishbone diagram maker with zero registration.
- Fishbone Diagram Template for Inventory Management Issues: A specialized template to jumpstart analysis of supply chain or stock problems.
- Fishbone Ishikawa Diagram of Customer Satisfaction Challenges: Map factors affecting customer experience with a ready-to-use framework.
Final Thought: AI isn’t about replacing human insight—it’s about amplifying it. The AI fishbone diagram generator from Visual Paradigm is designed for professionals who value rigor, clarity, and efficiency. Give it a try with a small problem. See how it structures your thoughts. You might just find that the “magic” is simply good engineering, working for you.

