


In the architecture of complex software systems, the database schema serves as the foundational bedrock upon which all application logic rests. For large-scale backend development teams, where dozens of engineers work concurrently on microservices or monolithic structures, the risk of data inconsistency and architectural drift is significant. A simple entity-relationship diagram (ERD) is not merely a drawing exercise; it is a critical communication tool that aligns engineering, product, and operations teams around a shared understanding of data flow.
When teams operate at scale, the cost of miscommunication regarding data relationships can lead to production incidents, data loss, or performance bottlenecks. The visual representation of how entities connect, relate, and constrain one another provides a blueprint that transcends individual developer expertise. It creates a single source of truth regarding the structure of information within the system.
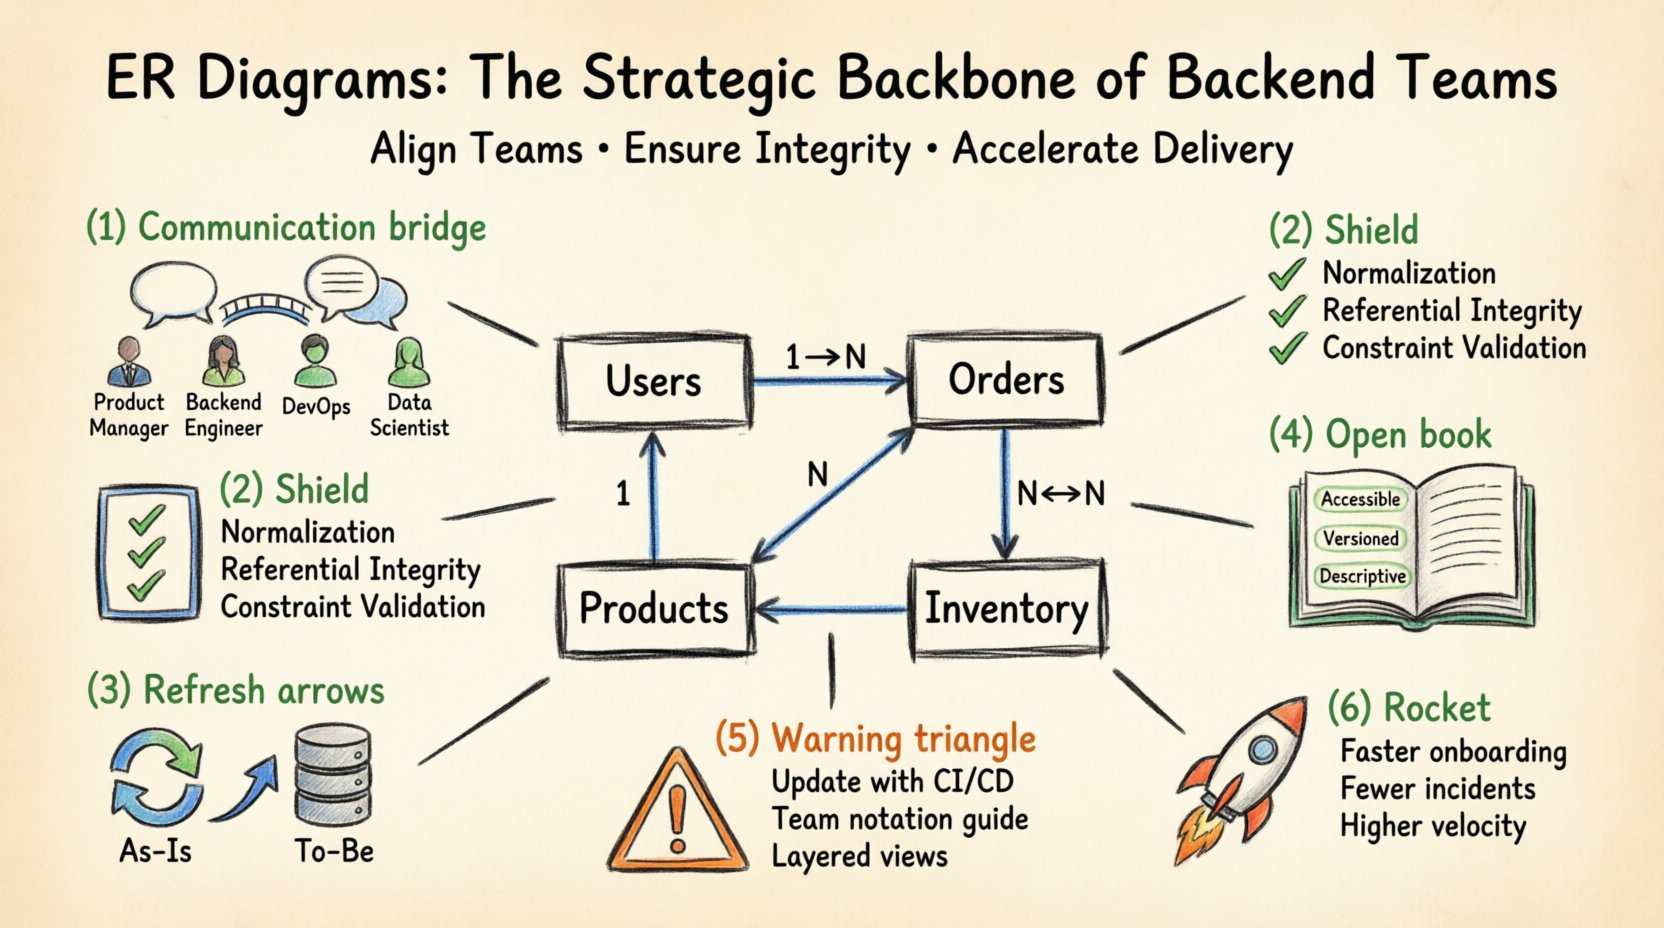
Defining the Entity-Relationship Diagram 📐
An ERD is a visual representation of the logical structure of a database. It maps out entities, which are typically tables, and the relationships between them. These diagrams use standardized notation to depict cardinality, such as one-to-one, one-to-many, and many-to-many associations. While the technical implementation might vary between relational and non-relational systems, the strategic intent remains the same: clarity.
For a backend team, the ERD acts as a contract. Before a single line of code is written to insert or query data, the diagram defines the boundaries. It specifies which fields are mandatory, which are optional, and how foreign keys bind different tables together. This definition is crucial for preventing logic errors where an application expects a specific data structure that does not exist.
Communication Across Distributed Teams 🤝
Large-scale development often involves multiple squads, each owning a specific domain. Without a unified visual standard, the Product Owner might envision a user having multiple addresses, while the Backend Engineer might implement a flat list, and the Data Analyst might expect a separate address table. This misalignment creates friction during integration.
An ERD bridges these gaps by providing a language that is understandable across disciplines.
- Product Managers: Can verify that the data model supports required business rules and user flows without needing to understand code syntax.
- Backend Engineers: Use the diagram to plan API endpoints, ensure efficient joins, and design caching strategies based on data access patterns.
- DevOps and SREs: Review the schema to plan database capacity, replication strategies, and backup procedures.
- Data Scientists: Analyze the structure to determine if the data is ready for analytics pipelines or machine learning models.
By centralizing the data model in a visual format, teams reduce the cognitive load required to understand the system. Instead of reading through hundreds of lines of migration scripts or schema definitions, a team member can look at a diagram and grasp the relationships between customers, orders, and inventory instantly.
Ensuring Data Integrity at Scale 🛡️
Data integrity is the accuracy and consistency of data over its lifecycle. In a large team, multiple developers might be modifying the schema simultaneously. Without a visual guide, it is easy to introduce conflicts. For example, one developer might add a foreign key to a table while another is refactoring that same table to remove a column.
The ERD helps enforce constraints before they become production issues. By visualizing the dependencies, architects can identify potential circular references or orphaned records that could corrupt data.
Key areas where ERDs protect integrity include:
- Normalization: The diagram helps teams identify when data is duplicated unnecessarily. Proper normalization reduces storage costs and prevents update anomalies.
- Referential Integrity: It clarifies how deletions cascade. If a user is deleted, should their orders be archived or deleted? The diagram makes this relationship explicit.
- Constraint Validation: It highlights unique constraints and primary keys, ensuring that identifiers remain unique across the entire dataset.
Facilitating Refactoring and Migration 🔄
Software is never static. As business requirements evolve, the data model must evolve with it. Large-scale teams often face the challenge of migrating legacy data to new structures. This process is fraught with risk. If the migration fails, data can be lost, or the application may become unusable.
An up-to-date ERD is the map for these migrations. It allows teams to simulate the changes before applying them. When planning a migration, engineers can compare the “as-is” diagram with the “to-be” diagram to generate a complete list of required transformations.
This visual comparison helps in:
- Identifying Dependencies: Determining which services rely on specific tables before breaking changes are made.
- Estimating Downtime: Understanding the volume of data involved in the schema change helps in planning maintenance windows.
- Rollback Planning: If a migration fails, the diagram helps engineers understand how to revert the schema to its previous state safely.
Documentation as a Living Asset 📚
Documentation often suffers from being outdated the moment it is written. However, an ERD that is kept in sync with the codebase becomes a living asset. It serves as the primary documentation for the data layer, which is often more critical than the application layer.
When a new engineer joins the team, they can spend weeks reading through code to understand the data flow. An ERD condenses this knowledge into a single view. It answers the question, “Where is the customer data stored?” immediately.
For knowledge transfer to be effective, the diagram should be:
- Accessible: Available to all team members, not locked in a specific developer’s local environment.
- Versioned: Tied to the version control system so that historical schema changes can be reviewed.
- Descriptive: Include comments on the diagram explaining complex business logic that cannot be represented by standard relationships.
Common Pitfalls and How to Avoid Them ⚠️
Even with the best intentions, teams often misuse or neglect ERDs. Recognizing these pitfalls is the first step toward using them effectively.
1. Over-Engineering Early On
Creating a perfect, fully normalized diagram before understanding the actual usage patterns can lead to rigid systems that are hard to change. It is often better to start with a simplified model and refine it as usage patterns emerge.
2. Ignoring the Diagram After Creation
If the diagram is not updated alongside the code, it becomes a source of confusion. Engineers might trust the diagram over the actual database schema, leading to errors when the two diverge.
3. Focusing Only on Tables
An ERD should not just show tables. It should also show relationships, cardinality, and constraints. Without this context, the diagram is just a list of tables.
| Pitfall | Impact | Mitigation Strategy |
|---|---|---|
| Outdated Diagrams | Confusion and errors during development | Integrate diagram updates into the CI/CD pipeline |
| Lack of Standards | Inconsistent notation across teams | Establish a team-wide notation guide |
| Too Much Detail | Visual clutter and reduced readability | Use layered views (High-level vs. Detailed) |
| Static Documentation | Knowledge becomes stale quickly | Automate generation from schema files |
Integrating Visuals into the Workflow ⚙️
To maximize the value of ERDs, they must be integrated into the daily workflow of the development team. This means moving beyond creating a diagram once and filing it away.
1. Design Phase
During the design phase of a new feature, the data model should be sketched out first. This ensures that the feature is viable from a data perspective before implementation begins. It prevents the common scenario where a feature is built, but the database cannot support the required queries efficiently.
2. Code Review
Schema changes should be reviewed alongside code changes. When a pull request includes a migration, the reviewer should check if the diagram has been updated to reflect the new structure. This keeps the documentation in sync with the code.
3. Incident Response
During post-mortems for data-related incidents, the ERD is a key artifact. It helps the team understand how the data flow contributed to the issue. Did a missing constraint allow bad data in? Did a relationship cause a performance bottleneck?
The Long-Term Impact on Team Velocity 🚀
Investing time in maintaining accurate ERDs pays dividends in the long run. Teams that prioritize data modeling tend to experience fewer production incidents related to data integrity. They also onboard new engineers faster because the learning curve is reduced.
When the data model is clear, engineers can focus on solving business problems rather than debugging schema issues. This shift in focus leads to higher quality software and faster delivery of value to the end user.
Moreover, a clear data model facilitates better collaboration with external partners. If the organization needs to expose data via APIs, a well-documented ERD makes it easier to design secure and efficient endpoints.
Conclusion on Data Modeling Practices 📝
The strategic value of an ERD extends far beyond simple documentation. It is a tool for governance, communication, and risk management in large-scale backend environments. By treating the data model as a first-class citizen of the software architecture, teams can build systems that are robust, scalable, and maintainable.
While the process requires discipline and ongoing maintenance, the alternative is a chaotic environment where data is a liability rather than an asset. The diagram provides the clarity needed to navigate the complexity of modern software systems.

