


The landscape of modern business strategy is complex, involving countless moving parts, stakeholders, and shifting market conditions. To navigate this complexity, organizations rely on structured frameworks. One such framework is the Business Motivation Model (BMM). While often discussed in theoretical terms, the true power of BMM emerges when it is visualized. This guide explores a visual approach to understanding Business Motivation Model dynamics, breaking down how goals, means, and influences interact to drive organizational success.
By translating abstract concepts into visual diagrams, teams can achieve a shared understanding of their strategic intent. This document serves as a comprehensive resource for analysts, strategists, and business leaders who wish to map their organizational motivations without relying on proprietary software tools.
Why Visualization Matters in Strategy 🎨
Text-heavy documents often fail to capture the nuance of interdependencies. A strategy document might list a goal and a supporting action, but it rarely shows the weight of influence or the cascading effect of a change. Visualization bridges this gap.
- Clarity of Intent: Diagrams allow stakeholders to see the “why” behind the “what.”
- Identification of Gaps: Visual maps reveal missing links between high-level goals and execution capabilities.
- Communication Efficiency: A single diagram can replace pages of narrative explanation.
- Change Impact Analysis: When a variable changes in the model, the visual connections show where ripples will occur.
When dealing with the Business Motivation Model, visualization transforms static lists into dynamic systems. It moves the conversation from “what are we doing?” to “how does this connect to our purpose?”
Core Components of the BMM Framework 🧩
Before drawing connections, one must understand the building blocks. The BMM is not a linear process; it is a web of relationships. Understanding these core elements is the first step toward effective modeling.
1. Incentives and Influencers
Incentives are external or internal factors that drive behavior. They can be positive (rewards, growth opportunities) or negative (regulations, penalties). Influencers shape the environment in which the organization operates. They do not dictate actions directly but set the context.
2. Goals and Means
Goals represent the desired outcomes. They are the “what” of the strategy. Means are the methods, capabilities, or resources used to achieve those goals. The relationship here is critical: a goal cannot exist without a viable means to achieve it.
3. Directives and Resources
Directives are the rules, policies, or constraints that govern how means are applied. Resources are the tangible assets required to execute the plan. Together, they ensure that the path to the goal is compliant and feasible.
4. Capabilities and Results
Capabilities are the specific skills or functions an organization possesses. Results are the actual outputs or outcomes produced by exercising those capabilities. The link between capability and result is the operational heartbeat of the model.
| Element | Definition | Visual Representation |
|---|---|---|
| Goal | A desired state or outcome. | Box with rounded corners |
| Mean | A method or resource to achieve a goal. | Arrow pointing to Goal |
| Influence | A factor affecting the value or likelihood. | Dashed line with diamond head |
| Directive | A constraint or rule applied to a means. | Line with double arrowheads |
| Stakeholder | An entity with an interest in the outcome. | Circle or Person Icon |
Mapping Relationships and Dependencies 🔗
Once the elements are defined, the next step is mapping how they relate. In a visual model, lines represent relationships. The type of line indicates the nature of the interaction. This section details the specific dynamics between the core components.
Goal-Driven Relationships
The most common relationship in BMM is the “means-to-goal” link. This is often depicted as a directed arrow. It answers the question: “How does this action help us reach that target?”
- Direct Means: An action that directly contributes to a goal (e.g., “Launch Product” leads to “Increase Revenue”).
- Indirect Means: An action that supports a means (e.g., “Hire Staff” supports “Launch Product”).
Influencing Relationships
Influences are distinct because they do not guarantee an outcome. Instead, they modify the probability or value of a goal. These are often shown with dashed lines.
- Positive Influence: Increases the likelihood of success or value.
- Negative Influence: Decreases the likelihood or value.
For example, a new regulation might negatively influence a specific goal. A visual model makes this tension visible immediately, allowing the team to plan mitigation strategies.
Directive Relationships
Directives act as constraints. They tell you how you can or cannot use a means. In a visual map, these often appear as annotations attached to the means or the relationship between means and goals.
- Compliance: Ensuring legal or ethical standards are met.
- Efficiency: Constraints on time or budget.
Understanding Feedback Loops and Dynamics ⚙️
The term “dynamics” refers to how the model changes over time or reacts to internal and external shifts. A static map is useful, but a dynamic model accounts for cause and effect.
Positive Feedback Loops
These occur when an action reinforces itself, leading to growth or acceleration. In a business context, this is often desirable but must be monitored.
- Example: Increased investment in training leads to higher productivity, which increases profit, allowing for more investment in training.
- Visual Cue: A cycle of arrows returning to the starting point.
Negative Feedback Loops
These loops stabilize the system. They act as a brake to prevent runaway growth or failure.
- Example: As inventory levels rise, the directive to produce new items decreases to prevent overstocking.
- Visual Cue: A cycle that counteracts the initial change.
Change Propagation
When a variable changes, how does it travel through the model? Visualizing this helps in risk assessment.
- Identify the Change: A new competitor enters the market.
- Trace the Influence: This negatively influences the “Market Share” goal.
- Trace the Means: The “Marketing Spend” means must be adjusted.
- Trace the Resources: Budget resources must be allocated.
This chain of events is much easier to follow on a diagram than in a text report.
Integrating Stakeholder Perspectives 👥
A business model does not exist in a vacuum. It exists within a network of people and groups. Stakeholders are the owners of the goals, the providers of the means, or the recipients of the results.
Mapping Ownership
Every element in the model should have an owner. This ensures accountability. Visualizing this involves grouping elements by department or role.
- Strategic Level: Board members, C-suite executives. They own the high-level goals.
- Tactical Level: Department heads. They own the means and capabilities.
- Operational Level: Team leads and staff. They own the execution and results.
Conflicting Interests
Stakeholders often have competing goals. A visual model can highlight these conflicts.
- Example: The Sales team wants to reduce price (Goal: Maximize Volume), while Finance wants to maintain margin (Goal: Maximize Profit).
- Resolution: The model shows the trade-off, allowing leadership to find a balance point rather than guessing.
Steps to Build Your Own Model 🛠️
Creating a Business Motivation Model is an iterative process. It starts with high-level abstraction and moves toward specific detail. Follow these steps to construct a robust visual model.
Step 1: Define the Scope
Decide what part of the organization you are modeling. Is it the entire enterprise, a specific department, or a single project? A clear scope prevents the model from becoming unmanageable.
Step 2: Identify Core Goals
Start with the “North Star.” List the top 5 to 10 goals that define success for this scope. Ensure they are measurable and specific.
Step 3: List Influencers
Brainstorm what could help or hinder these goals. Include market trends, regulations, and internal cultural factors. Do not worry about prioritization yet.
Step 4: Connect Means to Goals
For each goal, list the specific actions required to achieve it. Connect these actions with arrows. Review the connections to ensure they make logical sense.
Step 5: Add Directives and Constraints
Layer in the rules. What policies limit how the means can be used? Add these as annotations or specific constraint nodes.
Step 6: Validate with Stakeholders
Review the draft model with the people who will use it. Do they recognize their responsibilities? Do they see the logic in the connections? Refine based on feedback.
Common Pitfalls to Avoid ⚠️
Even with a clear framework, mistakes happen. Awareness of common errors helps maintain model integrity.
Over-Complexity
Attempting to model every single detail leads to a diagram that is unreadable. Keep the focus on strategic drivers. Operational details can be handled in separate, lower-level documents.
Ignoring Time
Some goals are immediate, while others are long-term. A static diagram often misses this temporal aspect. Use labels or color coding to indicate timelines (e.g., Short-term vs. Long-term).
Static Thinking
Treating the model as a one-time project is a mistake. Business conditions change. The model must be a living document that is updated regularly.
Disconnected Data
Ensure the metrics used to measure goals are accessible. If a goal cannot be measured, it is difficult to validate the model’s effectiveness.
Maintaining Model Integrity Over Time ⏳
A model is only as good as its accuracy. As the organization evolves, the model must evolve with it.
Regular Reviews
Schedule quarterly reviews of the BMM. Check if the goals are still relevant. Are the means still viable? Have new influencers emerged?
Version Control
Keep records of changes. If a goal is removed, document why. This historical data is valuable for understanding the organization’s decision-making journey.
Training and Onboarding
New employees need to understand the model. Use the visual diagrams as part of the onboarding process to explain how their role fits into the bigger picture.
Final Thoughts on Strategic Alignment 🚀
The Business Motivation Model is a powerful tool for aligning intent with action. By adopting a visual approach, organizations can move beyond abstract strategy documents and create a clear map of their operational reality.
This method encourages transparency. It allows teams to see how their daily work contributes to the broader mission. It highlights risks before they become crises. And most importantly, it provides a common language for discussion across different levels of the organization.
While tools and software can assist in the process, the core value lies in the thinking and the mapping itself. The visual representation is the catalyst for better decision-making and stronger organizational cohesion.
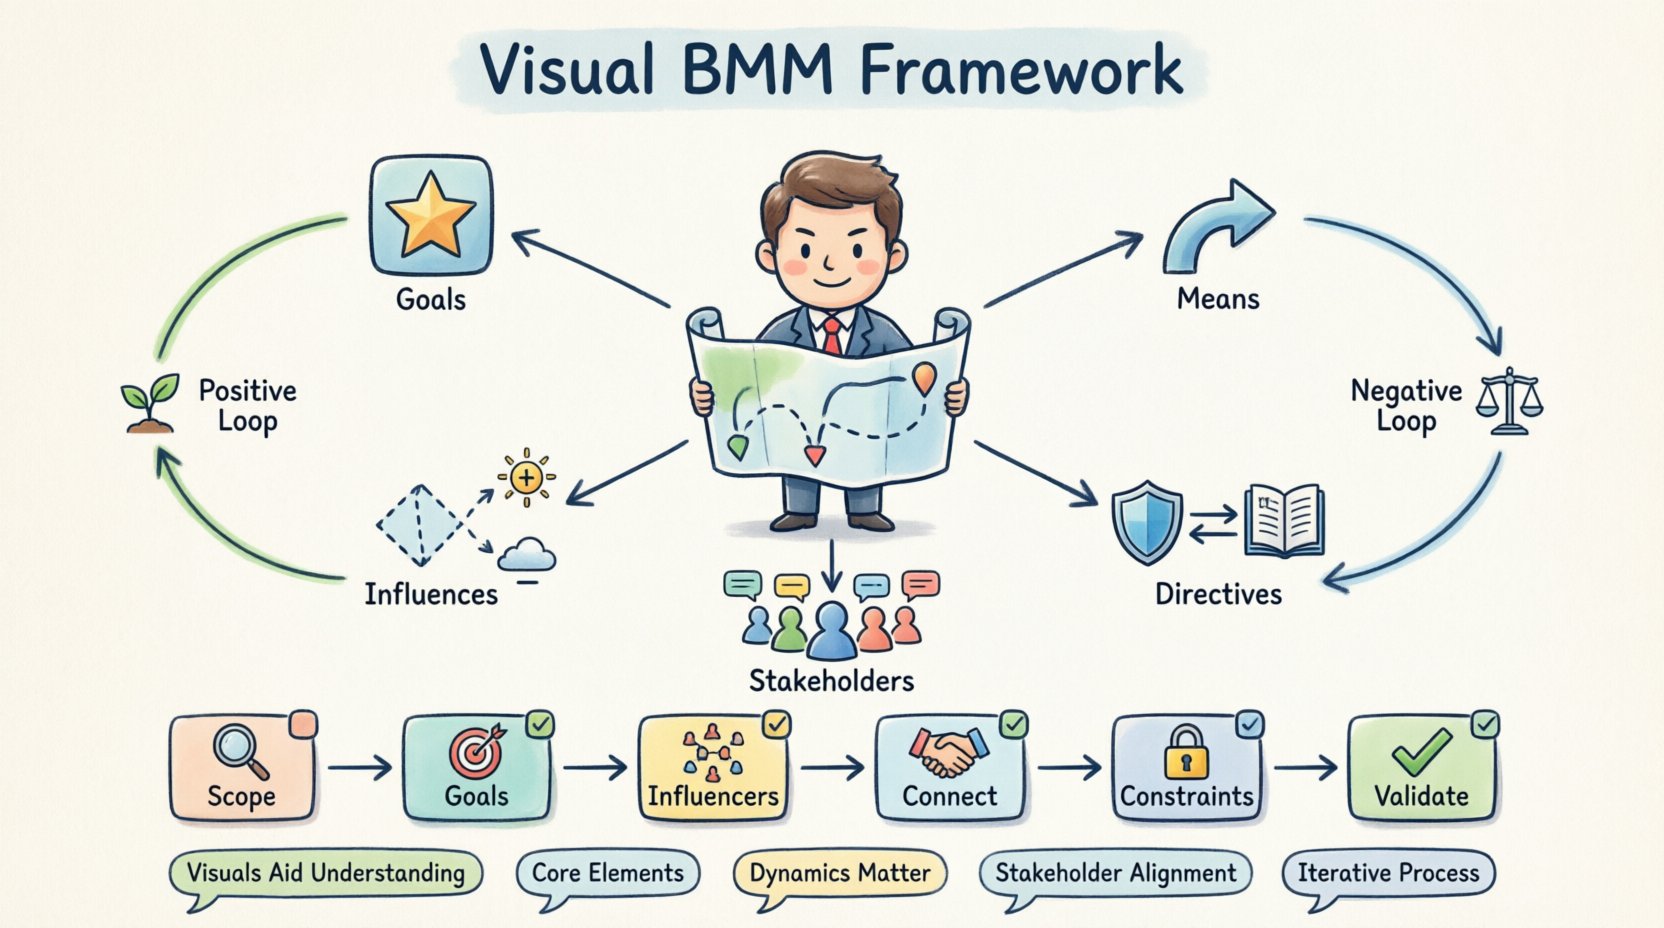
Key Takeaways 📝
- Visuals Aid Understanding: Diagrams reduce cognitive load and clarify complex relationships.
- Core Elements: Focus on Goals, Means, Influencers, and Directives.
- Dynamics Matter: Pay attention to feedback loops and change propagation.
- Stakeholder Alignment: Ensure all roles understand their place in the model.
- Iterative Process: Treat the model as a living document that evolves with the business.
Implementing this approach requires discipline and commitment, but the payoff is a more resilient and aligned organization. Start small, map one strategic area, and expand from there. The clarity gained is worth the effort.

