


Organizations often operate like a collection of isolated islands, where departments such as Sales, Operations, IT, and Finance speak different languages. Misunderstandings occur at handoff points, delays accumulate, and accountability becomes blurred. This fragmentation is not merely a management issue; it is a structural one. To resolve this, teams need a standardized visual language that transcends functional boundaries. Business Process Model and Notation (BPMN) provides exactly that.
By adopting BPMN 2.0 as a universal standard, cross-functional teams can visualize workflows with precision. This guide explores how to leverage BPMN to bridge gaps between departments, streamline complex handoffs, and foster a culture of shared process ownership. We will move beyond theory into practical application, focusing on the mechanics of collaboration without relying on specific proprietary tools.
🔍 The Challenge of Departmental Silos
When a request moves from one department to another, information is frequently lost or misinterpreted. This phenomenon is known as the “throw it over the wall” syndrome. Here is why this happens and how BPMN addresses it:
- Language Barriers: Technical teams use jargon that marketing cannot interpret, and finance uses metrics that operations find abstract.
- Hidden Dependencies: Teams often assume prerequisites are met when they are not, causing bottlenecks.
- Lack of Visibility: Individuals see only their own tasks, not the full lifecycle of the process.
- Inconsistent Standards: One team might handle approvals differently than another, creating variability in output quality.
BPMN acts as the translation layer. It does not replace human communication but structures it. A diagram created in BPMN is readable by a stakeholder in HR just as easily as it is by a developer in Engineering, provided they understand the basic notation.
⚙️ What is BPMN? A Technical Overview
BPMN is an open standard for business process modeling. It is maintained by the Object Management Group (OMG). The notation is designed to be understood by all business stakeholders, from the technical analysts who design the processes to the business managers who execute them.
Unlike flowcharts that use arbitrary shapes, BPMN uses specific symbols with defined meanings. This consistency reduces ambiguity. When a team agrees on the notation, the diagram becomes a single source of truth. It captures the logic, the rules, and the flow of information between roles.
Key Principles of BPMN
- Standardization: Symbols mean the same thing regardless of who draws them.
- Complexity Handling: It can model simple linear tasks or complex, event-driven scenarios.
- Executable Potential: While this guide focuses on modeling, the notation supports execution in automated environments.
- Human Readability: The primary goal is communication, not just code generation.
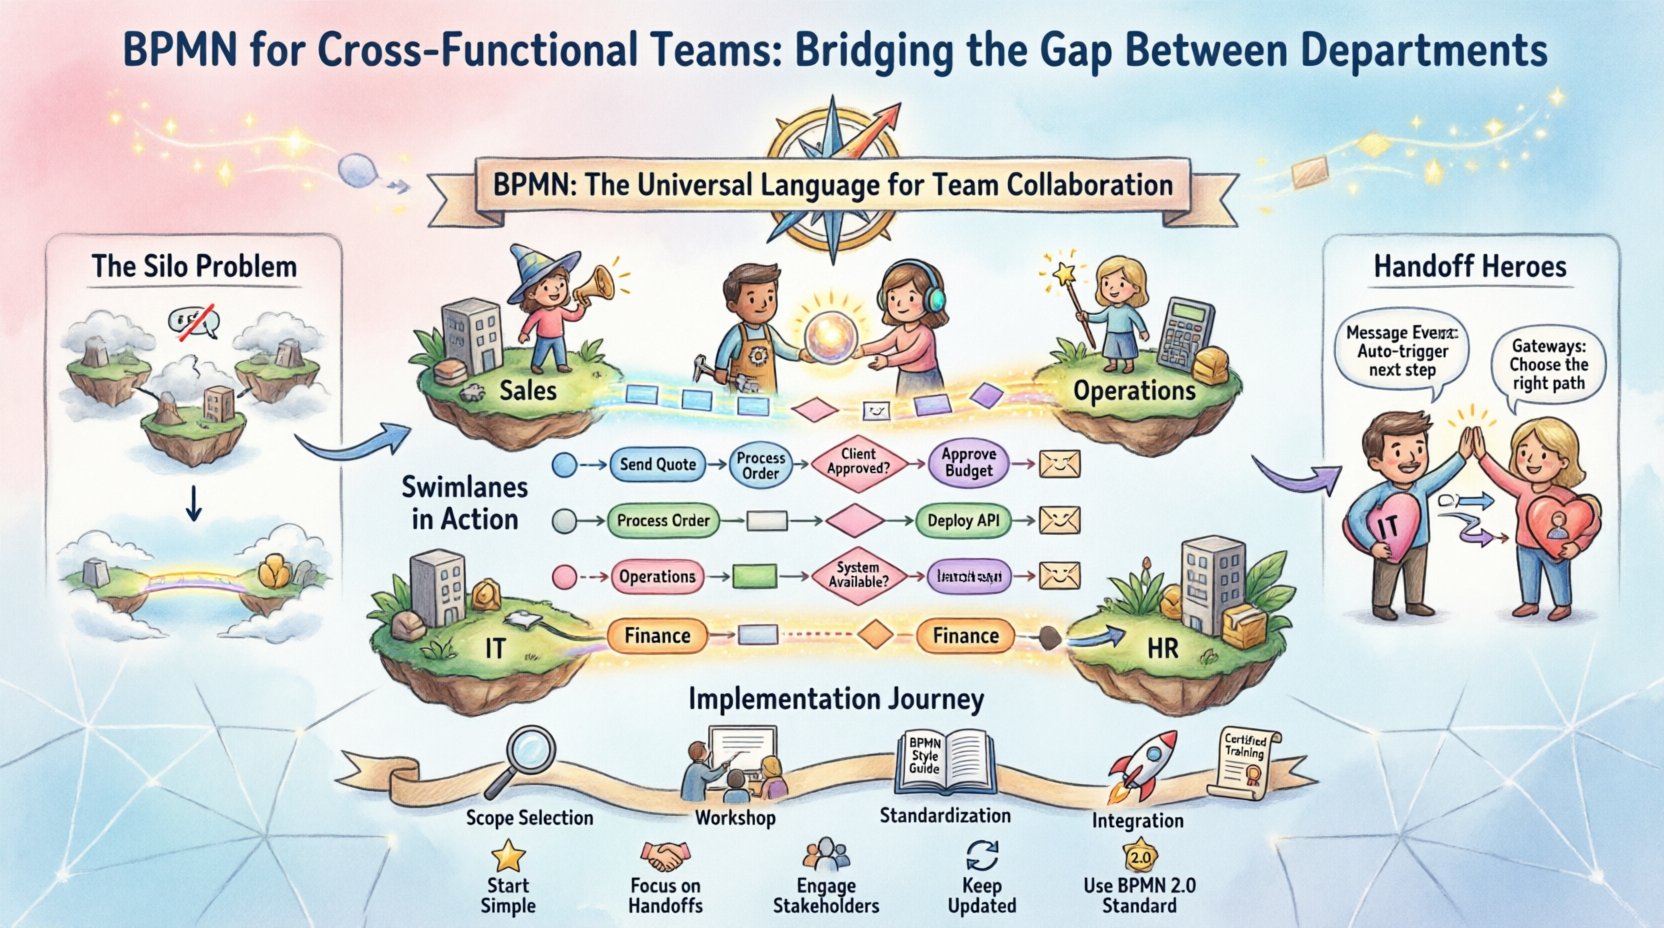
🌊 Swimlanes: The Core of Collaboration
The most critical BPMN feature for cross-functional teams is the Swimlane. A swimlane visually segregates the participants in a process. It answers the question: “Who is responsible for this step?”
For a cross-functional team, the horizontal or vertical lanes represent departments. This visual separation makes it immediately obvious when a process crosses a boundary. It highlights the moment of handoff.
Benefits of Swimlanes in Team Settings
- Clarifies Ownership: Each lane clearly states which department owns the task.
- Identifies Handoffs: Arrows crossing between lanes represent the transfer of work.
- Reveals Bottlenecks: If an arrow points to a lane where work accumulates, that department is a bottleneck.
- Reduces Blame: It is easier to discuss process design than individual performance when the model is the focus.
Consider a standard Order-to-Cash process. Without swimlanes, you see a list of tasks. With swimlanes, you see the flow from Sales (Order Entry) to Finance (Credit Check) to Logistics (Shipping) to Customer Service (Billing). The visual gap between Finance and Logistics becomes a focal point for optimization.
🤝 Mapping Handoffs: Critical Moments
The most friction in cross-functional work occurs at the handoff. This is where the “ball” is thrown from one team to another. BPMN allows you to model these moments explicitly using Events and Gateways.
When modeling handoffs, consider the following elements:
- Message Flows: Use dashed lines to represent information exchange between pools (different organizations or distinct departments) rather than just sequence flows.
- Intermediate Events: These capture the state of the process while it is waiting. For example, a “Timer Intermediate Event” represents a waiting period, such as “Awaiting Customer Approval.”
- This distinguishes between work being done and work being waited on.
- Gateways: Decision points where the path splits based on data. This prevents the receiving department from guessing what to do next.
By modeling the handoff, you force the team to define the criteria for the transfer. Is the work “done” when the email is sent, or when the file is attached? BPMN requires you to define the trigger for the next step.
📊 Common Symbols for Departmental Handoffs
To ensure clarity, teams should agree on a legend. Below is a reference table for symbols specifically useful in inter-departmental modeling.
| Symbol Name | Shape | Function in Cross-Functional Context |
|---|---|---|
| Start Event | Circle (Thin Border) | Indicates where the process enters the specific department’s view. |
| End Event | Circle (Thick Border) | Indicates where the department’s responsibility is complete. |
| Task | Rounded Rectangle | A specific unit of work assigned to a role within the lane. |
| Sub-Process | Large Rounded Rectangle with + Icon | Hides complexity; useful when a department has an internal workflow that feeds into the larger process. |
| Exclusive Gateway | Diamond (X) | Represents a decision point (e.g., Approved vs. Rejected) that dictates the path. |
| Message Flow | Dashed Line with Circle Arrow | Shows communication between different pools or departments. |
| Parallel Gateway | Diamond (+) | Splits work to be done simultaneously by different teams. |
🚀 Implementation Roadmap: From Concept to Practice
Adopting BPMN is a cultural shift as much as a technical one. It requires a structured approach to ensure the models are useful and not just decorative. Follow this phased approach to integrate BPMN into your cross-functional workflow.
Phase 1: Selection and Scope
- Identify High-Impact Processes: Do not model everything at once. Choose processes that cross the most boundaries or cause the most friction.
- Define the Scope: Clearly mark where the process starts and ends. Do not include internal steps that do not affect the handoff.
- Form the Modeling Team: Include representatives from every department involved in the process.
Phase 2: The Workshop
- Whiteboard First: Do not use digital tools immediately. Use physical cards or whiteboard markers to draft the flow.
- Role Mapping: Physically assign tasks to lanes. Ensure every task has a home.
- Conflict Resolution: If two departments claim a task, resolve it immediately in the workshop. This clarifies accountability.
- Validate the Flow: Walk through the diagram step-by-step. Ask “What happens if this fails?”
Phase 3: Standardization and Documentation
- Create a Style Guide: Define font sizes, lane heights, and arrow styles to ensure consistency across all diagrams.
- Version Control: Treat the diagrams as living documents. Label them with version numbers and dates.
- Archive Old Versions: Keep records of how the process used to work to understand evolution over time.
Phase 4: Integration and Training
- Training Sessions: Conduct short sessions for team members on how to read the BPMN diagrams.
- Link to SOPs: Connect the visual diagrams to written Standard Operating Procedures (SOPs).
- Review Cadence: Schedule quarterly reviews to update the models as business rules change.
⚠️ Common Pitfalls and How to Avoid Them
Even with the best intentions, teams often stumble when introducing process modeling. Being aware of these common errors can save time and frustration.
- Over-Modeling: Trying to capture every single edge case makes the diagram unreadable. Focus on the “Happy Path” first, then add exceptions later.
- Ignoring Exceptions: A process is only as strong as its error handling. Ensure you model what happens when an approval is denied or data is missing.
- Too Many Levels of Detail: Do not model the sub-steps of a task inside the main diagram. Use Sub-Processes to encapsulate complexity.
- Lack of Governance: Without a designated owner, diagrams become outdated quickly. Assign a “Process Owner” for each major workflow.
- Ignoring the Human Element: BPMN is not just about logic; it is about people. Ensure the tasks assigned are realistic for the roles involved.
🛠️ Roles and Responsibilities in Process Modeling
Successful cross-functional modeling requires clear roles. A matrix approach helps define who does what during the creation and maintenance of the diagrams.
| Role | Responsibility | Department Example |
|---|---|---|
| Process Owner | Accountable for the end-to-end performance and accuracy of the process. | Operations Director |
| Modeler | Translates verbal descriptions into the BPMN notation accurately. | Business Analyst |
| SME (Subject Matter Expert) | Provides the technical details of the tasks within their department. | Senior Developer or Accountant |
| Stakeholder | Reviews and approves the model to ensure it meets business needs. | Department Head |
📈 Measuring Impact and Continuous Improvement
Once the models are in place, you need to measure their effectiveness. The goal is not just to draw pictures, but to improve performance. Use the following metrics to track success:
- Process Cycle Time: How long does it take to move from the start event to the end event across all departments?
- Handoff Latency: Measure the time between one department completing a task and the next department starting it.
- Error Rate: How often does a process fail due to miscommunication or missing data at a handoff?
- Compliance Adherence: Are the steps in the BPMN model matching the actual work being performed?
Regular audits of the diagrams against reality are essential. If the model does not match the process, it is not a model; it is fiction. Update the BPMN whenever a change occurs in policy, technology, or personnel.
🔄 Maintenance and Governance
A process model is not a one-time deliverable. It is a living artifact. To maintain its value, implement a governance framework.
- Change Management: Any change to the process must go through a review board before the diagram is updated.
- Notification System: When a process changes, all affected departments must be notified immediately.
- Training Updates: If the process changes, training materials must be updated simultaneously.
- Digital Repository: Store diagrams in a central, accessible location where all team members can view the latest version.
🔗 The Role of Communication in BPMN
BPMN does not replace conversation; it enhances it. When a team gathers to review a diagram, the conversation shifts from opinions to facts. The diagram serves as the focal point.
- Shared Vocabulary: Instead of arguing about who did what, the team discusses the specific symbol on the page.
- Visual Evidence: Data points on the diagram can be discussed objectively. “The diagram shows a 3-day wait here.”
- Collaborative Design: Building the diagram together fosters ownership. When teams build the map, they are more likely to follow the path.
🏁 Summary of Best Practices
To successfully implement BPMN for cross-functional teams, adhere to these core principles:
- Start Simple: Begin with high-level swimlanes before diving into granular details.
- Focus on Handoffs: Spend the most time refining the boundaries between departments.
- Engage Stakeholders: Ensure every department has a voice in the modeling process.
- Keep it Updated: Treat the diagrams as living documents that evolve with the business.
- Use Standard Notation: Stick to the BPMN 2.0 standard to ensure universal understanding.
By bridging the gap between departments with a clear, standardized visual language, organizations can reduce friction, improve speed, and enhance collaboration. BPMN is not just a tool for analysts; it is a tool for everyone involved in the workflow.

