


Process modeling is often perceived as a technical task reserved for IT specialists or data architects. The acronyms and symbols can feel like a secret language, creating barriers between business stakeholders and the teams responsible for execution. However, the standard known as Business Process Model and Notation (BPMN) was designed with a specific purpose: to be readable by both technical and non-technical participants.
When business users, managers, and analysts understand process diagrams, the gap between strategy and execution narrows significantly. This guide provides a clear path to understanding BPMN without needing a background in software development or complex system architecture.
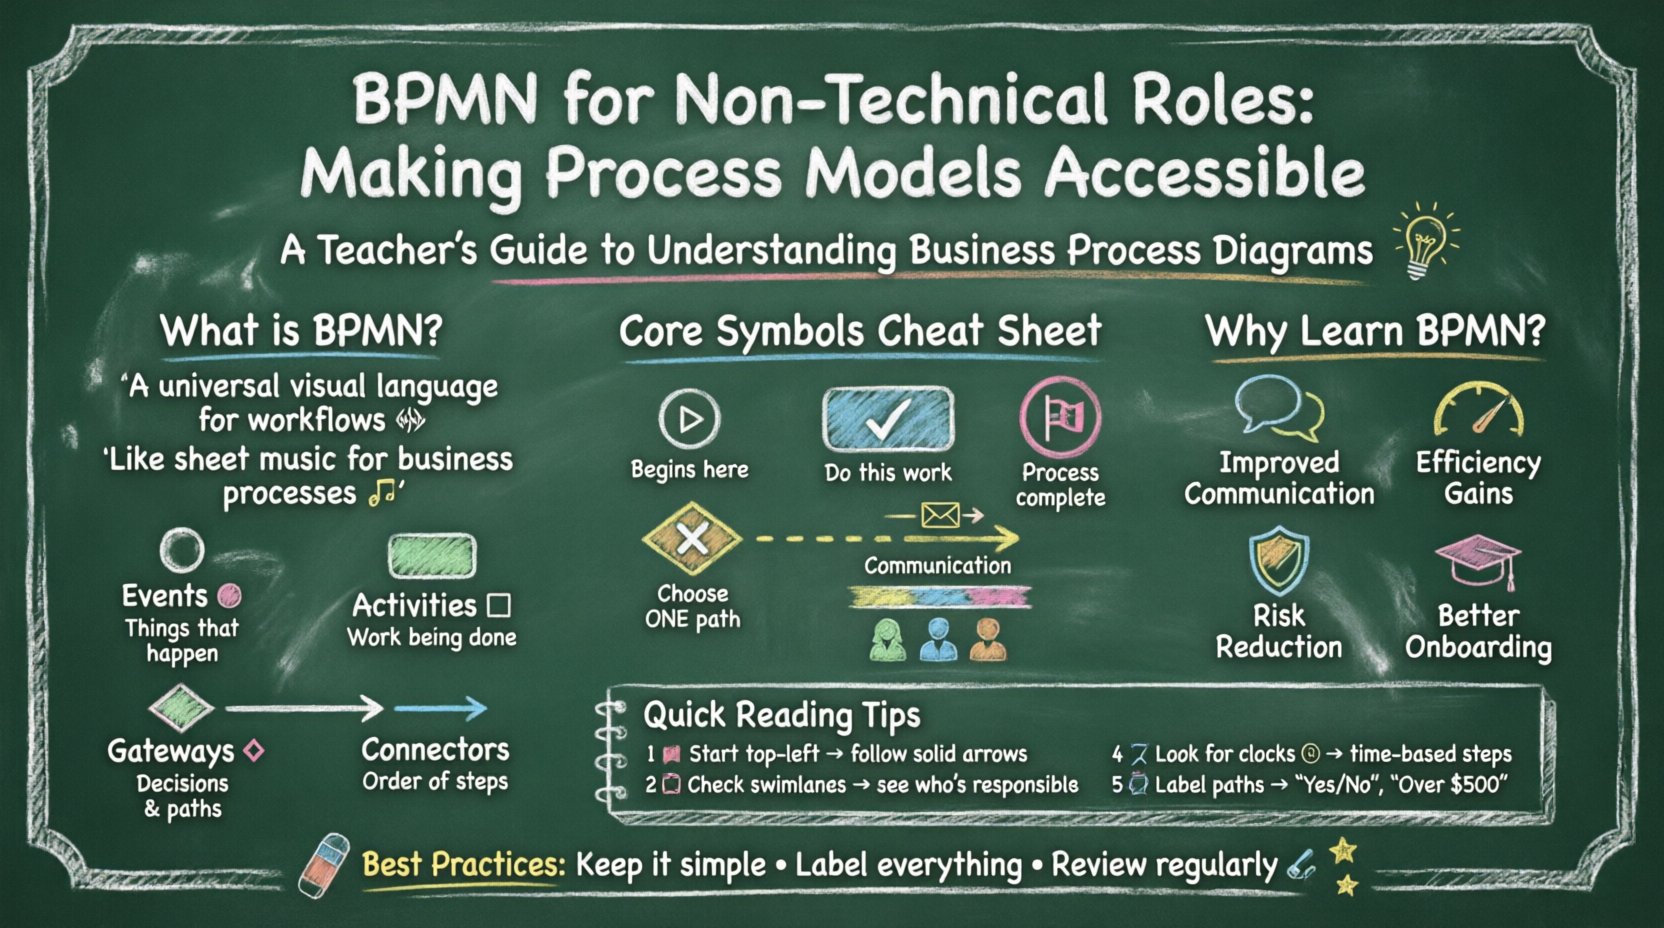
🧩 What Is BPMN?
BPMN is an international standard used for defining business processes. Think of it as a universal visual language for workflows. Just as musicians use sheet music to understand a score regardless of their instrument, teams use BPMN to understand a process regardless of the software used to automate it.
The notation relies on a set of graphical symbols that represent different elements of a workflow. These elements include:
- Events: Things that happen during the process.
- Activities: The work being done.
- Gateways: Decisions that determine the flow.
- Connectors: The lines that show the order of steps.
By standardizing these symbols, organizations ensure that a diagram created today can be understood by a stakeholder tomorrow, even if team members change. This consistency is vital for maintaining operational clarity.
🤝 Why Non-Technical Staff Need This Knowledge
Many organizations struggle with siloed information. The marketing team may have a different view of the customer onboarding journey than the sales team, who have a different view than the fulfillment team. BPMN acts as a single source of truth that bridges these gaps.
Here are the core benefits of adopting this notation for non-technical roles:
- Improved Communication: Visual diagrams reduce ambiguity. A picture is often worth a thousand words when describing a complex handoff.
- Efficiency Gains: Identifying bottlenecks becomes easier when the flow is visible. You can spot where tasks pile up or where approvals get stuck.
- Risk Reduction: Understanding the “what if” scenarios helps prevent compliance issues or service failures before they occur.
- Better Onboarding: New employees can learn the standard operating procedures by looking at the diagrams rather than relying solely on verbal explanations.
🎨 Core Symbols and Notation Explained
To read a BPMN diagram, you must recognize the shapes. The notation is divided into four main categories: Events, Activities, Gateways, and Connecting Objects. Below is a breakdown of the most common symbols you will encounter.
1. Events (Circles)
Events represent something that happens during the process. They are depicted as circles. The thickness of the circle’s border indicates the type of event.
- Start Event: A thin circle. This is where the process begins. It is usually marked with a plus sign or a clock icon.
- End Event: A thick circle. This signifies the completion of the process. It often contains a stop sign or a checkmark.
- Intermediate Event: A circle with a single thin border. This represents something that occurs in the middle of the process, such as receiving a message, a timer expiring, or an error occurring.
2. Activities (Rounded Rectangles)
Activities represent work that is performed. These are the main tasks within the process.
- Task: A rounded rectangle. This is the smallest unit of work that cannot be broken down further in this context. For example, “Approve Invoice” or “Send Email”.
- Sub-Process: A rounded rectangle with a plus sign. This indicates a complex task that can be expanded into a detailed sub-diagram.
- Call Activity: A rounded rectangle with a thick border. This calls a reusable process definition from another part of the model.
3. Gateways (Diamonds)
Gateways control the flow of the process. They act as decision points where the path diverges or converges.
- Exclusive Gateway: A diamond with an ‘X’. This means only one path can be taken. If condition A is true, go left. If condition B is true, go right.
- Inclusive Gateway: A diamond with a circle. This allows one or more paths to be taken simultaneously based on multiple conditions.
- Parallel Gateway: A diamond with a plus sign. This splits the flow into multiple paths that happen at the same time, or merges them back together.
4. Connecting Objects
These lines connect the shapes and dictate the order of operations.
- Sequence Flow: A solid arrow. It shows the order of activities.
- Message Flow: A dashed arrow. It shows communication between different participants or pools.
- Association: A dashed line. It connects text or data to an activity.
📋 Understanding Swimlanes
One of the most powerful features of BPMN is the use of swimlanes. These divide the diagram to show who is responsible for each step.
There are two main types of swimlanes:
- Pools: Represent distinct participants, such as different organizations or major departments.
- Lanes: Represent roles or functions within a single participant.
When you look at a diagram, you can trace a specific lane to see exactly what that role needs to do. This clarifies accountability and prevents tasks from falling through the cracks.
| Element | Shape | Meaning | Example |
|---|---|---|---|
| Start Event | Thin Circle | Process Begins | Customer places order |
| Task | Rounded Rectangle | Work Item | Verify Payment |
| Exclusive Gateway | Diamond (X) | Decision Point | Is stock available? |
| End Event | Thick Circle | Process Ends | Order Shipped |
| Message Flow | Dashed Arrow | Communication | Email sent to customer |
🔍 Reading vs. Creating Models
For most non-technical professionals, the primary goal is reading and interpreting diagrams rather than designing them from scratch. However, understanding the creation logic helps you critique and improve existing models.
Reading a Diagram
Start at the top left. Follow the solid arrows. Check the swimlanes to identify who is acting. Look for diamonds to understand decision logic. If you see a circle with a clock, understand that time is a factor here.
Creating a Model
If you are asked to document a process, follow these steps:
- Identify the Trigger: What starts the process? An email? A customer request? A timer?
- Map the Steps: Write down every action in order. Do not skip steps.
- Define Decisions: Where do choices happen? What are the conditions?
- Assign Roles: Which swimlane does each step belong to?
- Identify the End: What does success look like? When do we stop?
⚠️ Common Pitfalls and Best Practices
Even experienced process modelers can make mistakes that confuse non-technical readers. Avoid these common errors to maintain clarity.
- Don’t Overcomplicate: If a process is too complex, break it down into sub-processes. A single diagram with 50 steps is hard to read.
- Avoid Orphaned Connections: Ensure every arrow points to a valid shape. Floating lines indicate errors.
- Keep Gates Simple: Avoid cascading decision points. If you have too many diamonds in a row, the logic becomes hard to follow.
- Use Consistent Naming: If a task is called “Review” in one place and “Approve” in another, it creates confusion. Standardize your terminology.
- Label Your Paths: Every arrow leaving a gateway should have a label explaining the condition (e.g., “Yes”, “No”, “Over $500”).
🛠 Implementing BPMN in Workflow
Once you understand the notation, the next step is integrating it into your daily operations. This is not about buying new software; it is about changing how you communicate.
1. Document Standard Operating Procedures (SOPs)
Replace text-heavy manuals with visual diagrams. A diagram can be scanned in seconds, whereas a document takes minutes to read. This makes it easier for staff to reference procedures quickly.
2. Conduct Process Audits
Use the diagrams to verify compliance. Compare the “as-is” model (what is actually happening) with the “to-be” model (what should happen). Differences highlight areas for improvement or training.
3. Facilitate Workshops
Bring stakeholders together to review a diagram. Ask questions like, “Is this step necessary?” or “Can this decision happen earlier?” This collaborative approach ensures buy-in from all departments.
📚 Training and Adoption Strategies
Adopting BPMN requires a shift in mindset. It is not just about drawing shapes; it is about thinking logically about flow and logic.
Internal Training
Organize sessions where senior staff walk new employees through existing diagrams. This peer-to-peer knowledge transfer is often more effective than formal classroom training.
Continuous Learning
Encourage staff to explore online resources and tutorials. There are many free guides available that explain the notation in detail. Familiarity grows with practice.
Feedback Loops
Create a mechanism for users to report errors in the diagrams. If a process changes in reality but the diagram does not, it becomes outdated. Regular reviews keep the models accurate.
🔄 Continuous Improvement
Processes are not static. Markets change, technology evolves, and customer expectations shift. BPMN models must evolve with them.
Regularly schedule reviews of your process maps. Ask:
- Are there steps that are no longer needed?
- Are there new compliance requirements we must add?
- Can we automate any manual tasks shown in the diagram?
- Is the handoff between departments smoother now?
By treating the diagram as a living document, you ensure that the organization remains agile and responsive to change.
🏁 Final Thoughts
Understanding BPMN empowers non-technical roles to take ownership of their workflows. It transforms abstract processes into concrete visual maps that everyone can understand. This shared understanding reduces errors, speeds up execution, and fosters a culture of continuous improvement.
You do not need to be a software engineer to leverage this standard. With a basic grasp of the symbols and a commitment to clarity, you can become a valuable asset in process optimization. Start by mapping one small process today. Watch how the conversation changes when you have a visual reference to discuss.
Remember, the goal is not perfection in the first draft. The goal is communication. Use these tools to bridge the gap between ideas and execution, ensuring that every team member is aligned on the path forward.

