


Business Process Model and Notation (BPMN) is often discussed in the context of large enterprise systems. However, the principles behind this standard notation offer significant value to smaller organizations. This guide examines a practical application of BPMN within a small logistics company. We will explore how visualizing workflows can clarify operations, reduce errors, and improve efficiency without relying on specific software products.
Why Visualize Processes? 🤔
Many small businesses operate on tribal knowledge. Tasks are passed from person to person, and the “how” is often oral rather than written. This creates risks when employees leave or during periods of high volume. A standardized diagram helps everyone see the same path.
- Clarity: Everyone understands the start and end points.
- Consistency: Reduces variation in how tasks are performed.
- Identification: Makes it easier to spot where delays occur.
The Case Study: GreenLeaf Logistics 🚚
GreenLeaf Logistics is a fictionalized representation of a typical small business with 15 employees. They handle regional freight for local manufacturers. Before implementing BPMN, their order fulfillment process was fragmented.
The Challenge
Customer complaints were rising. Orders were delayed, and inventory counts did not match records. The team spent too much time searching for information rather than moving packages.
The management team decided to map their core process. They wanted to understand:
- Where do orders actually enter the system?
- Who is responsible for checking stock?
- What happens when a truck is not available?
Mapping the As-Is Process 📝
The first step was creating a diagram of the current state. This is often called the “As-Is” model. The goal was not to judge, but to record reality.
Key Activities Mapped
- Order Intake: Received via email or phone.
- Verification: Staff checks if items are in stock.
- Picking: Warehouse team gathers the goods.
- Packing: Items are boxed and labeled.
- Dispatch: Driver is assigned and route planned.
- Delivery: Customer receives the shipment.
Understanding the Symbols Used 🔠
To make the diagram useful, the team used standard BPMN shapes. This ensures that anyone familiar with the notation can read the flow. Below is a table of the specific symbols used in this project.
| Symbol Name | Visual Description | Function in Workflow |
|---|---|---|
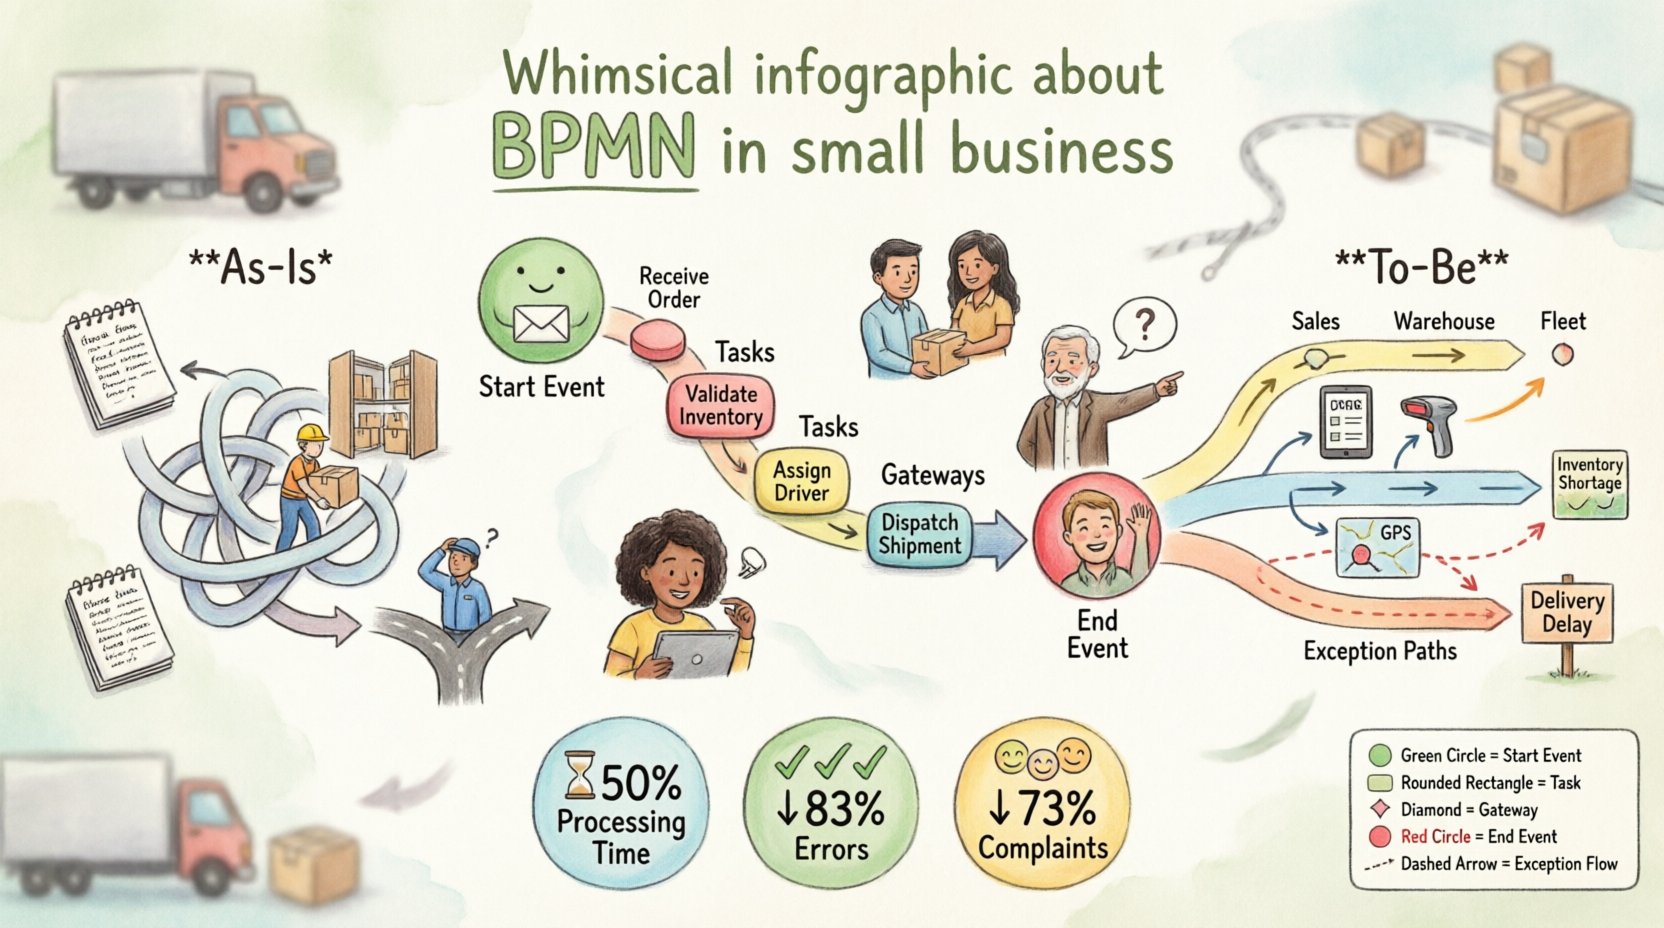
| Start Event | 🟢 Circle (Green) | Indicates the trigger, such as receiving an email. |
| Task | ⬜ Rounded Rectangle | A single unit of work, like “Check Stock”. |
| Gateway (Decision) | 🔶 Diamond | A branch point, e.g., “Is stock available?” |
| End Event | 🔴 Circle (Red) | The finish line of the process. |
| Message | 📩 Envelope | Communication between actors or external systems. |
| Sub-Process | ⬛ Rounded Square | A group of tasks treated as a single block. |
Identifying Bottlenecks 🔍
Once the diagram was drawn, the team reviewed it. They looked for areas where the flow stopped or where multiple people touched the same task without clear handoffs.
Findings from the Analysis
- Manual Data Entry: Orders were typed twice. Once into a notebook, once into the database. This introduced typos.
- Stock Verification: The person checking stock did not have real-time access to the warehouse location. They had to walk the floor, causing delays.
- Driver Assignment: No clear rule existed for assigning drivers. Sometimes a driver was assigned before the truck was ready.
The Diamond Gateway revealed a critical issue. If stock was low, the process looped back to the start without a time limit. This created an infinite wait state.
Designing the To-Be Process 🛠️
With the problems identified, the team designed a “To-Be” model. This is the ideal state they aimed to reach. The focus was on removing unnecessary steps and clarifying responsibilities.
Changes Implemented
- Automated Intake: Orders were moved to a centralized digital list immediately upon receipt.
- Parallel Tasks: Packing and Dispatch planning were allowed to happen at the same time, rather than one after the other.
- Clear Exceptions: The decision gateways were updated. If stock is unavailable, the order is paused and the customer is notified immediately, rather than waiting indefinitely.
This restructured the workflow into lanes. Each lane represented a role, such as “Sales”, “Warehouse”, or “Fleet”. This made it clear who owned each step.
Implementation Steps 🚀
Creating a diagram is only half the work. The team had to get the staff to use it.
- Training Sessions: Staff were shown the new diagram. They discussed what each box meant.
- Printed Copies: Physical copies were placed at the dispatch desk and warehouse entrance.
- Feedback Loop: After one week, the team met to discuss what was confusing. The diagram was adjusted based on this feedback.
- Standardization: A rule was set that no changes to the process could happen without updating the diagram.
Measuring Success 📈
After three months of using the new process, the results were compared against the previous metrics. The following table shows the key performance indicators (KPIs).
| Metric | Before BPMN | After BPMN | Change |
|---|---|---|---|
| Order Processing Time | 48 Hours | 24 Hours | ↓ 50% |
| Data Entry Errors | 12 per week | 2 per week | ↓ 83% |
| Customer Complaints | 15 per month | 4 per month | ↓ 73% |
| Driver Idle Time | High | Low | Significant Improvement |
Common Pitfalls to Avoid ⚠️
During this project, the team encountered several challenges. Understanding these can help others avoid similar mistakes.
- Over-Engineering: The first draft was too detailed. It showed every click of a mouse. The team learned to focus on business logic, not software clicks.
- Lack of Ownership: Initially, no one felt responsible for the diagram. One person was assigned as the “Process Owner” to keep it updated.
- Ignoring Exceptions: The first version only showed the “Happy Path” (where everything goes right). The team had to go back and map what happens when things break.
- Too Many Gateways: There were too many decision points. This made the diagram look like spaghetti. They consolidated similar decisions to simplify the view.
Maintenance and Evolution 🔄
Business processes are not static. New regulations, new products, or new staff can change how work gets done. The diagram must evolve.
Best Practices for Updates
- Quarterly Reviews: Schedule a time every three months to walk through the map with the team.
- Version Control: Save previous versions of the diagram. This helps if a new change causes issues.
- Onboarding: Use the diagram to train new hires. It serves as a visual job description.
Technical Details of the Notation 🧩
For those interested in the technical side, the notation used follows the Object Management Group (OMG) standards. This ensures that the diagram can be read by different people or systems in the future.
Sequence Flows: Solid arrows show the order of tasks. If the flow is conditional, a dashed line is used.
Message Flows: Dotted arrows show communication between different pools or lanes. In this case, emails between sales and warehouse used this symbol.
Associations: These connect text annotations to specific tasks to provide extra context without cluttering the main flow.
Impact on Team Culture 👥
Beyond the numbers, the culture of the business changed. Employees felt more secure knowing exactly what was expected. The ambiguity was reduced.
- Transparency: Everyone could see the whole picture, not just their own task.
- Collaboration: Handoffs between departments became smoother because the boundaries were clear.
- Accountability: When a delay occurred, it was easier to identify which step caused it.
Resources for Further Learning 📚
If you want to explore this further, there are several resources available.
- Official Notation Guide: Available from the standards organization.
- Community Forums: Places to discuss specific modeling questions.
- Workshops: Local training sessions often cover process mapping basics.
Final Thoughts 💡
Applying BPMN to a small business does not require a massive budget or complex technology. It requires a willingness to look at how work is actually done and a commitment to standardizing it. The visual language of BPMN provides a common ground for discussion.
By mapping the As-Is state, identifying the bottlenecks, and designing a To-Be state, GreenLeaf Logistics improved its efficiency significantly. The process map became a living document that guided daily operations and long-term planning.
Small businesses can gain the same advantages. Start small, focus on one core process, and expand from there. The goal is not perfection, but continuous improvement.

