


Business Process Model and Notation (BPMN) is the standard language for describing workflows. It bridges the gap between business stakeholders and technical teams. However, a diagram that looks correct technically can fail completely if it is difficult to read. Clarity is not just an aesthetic choice; it is a functional requirement. When a process map is confusing, errors occur, training takes longer, and adoption stalls.
This guide outlines how to design BPMN diagrams that communicate effectively. We focus on notation rules, layout strategies, and cognitive load management to ensure your models serve their purpose. The goal is to create visual artifacts that anyone involved in the process can understand without needing a degree in process engineering.
1. Understanding the Visual Language 📖
Before drawing a single line, you must understand the core symbols. BPMN uses specific shapes to represent different types of actions and events. Mixing these up creates ambiguity. Consistency in symbol usage reduces the cognitive effort required to interpret the diagram.
The Core Elements
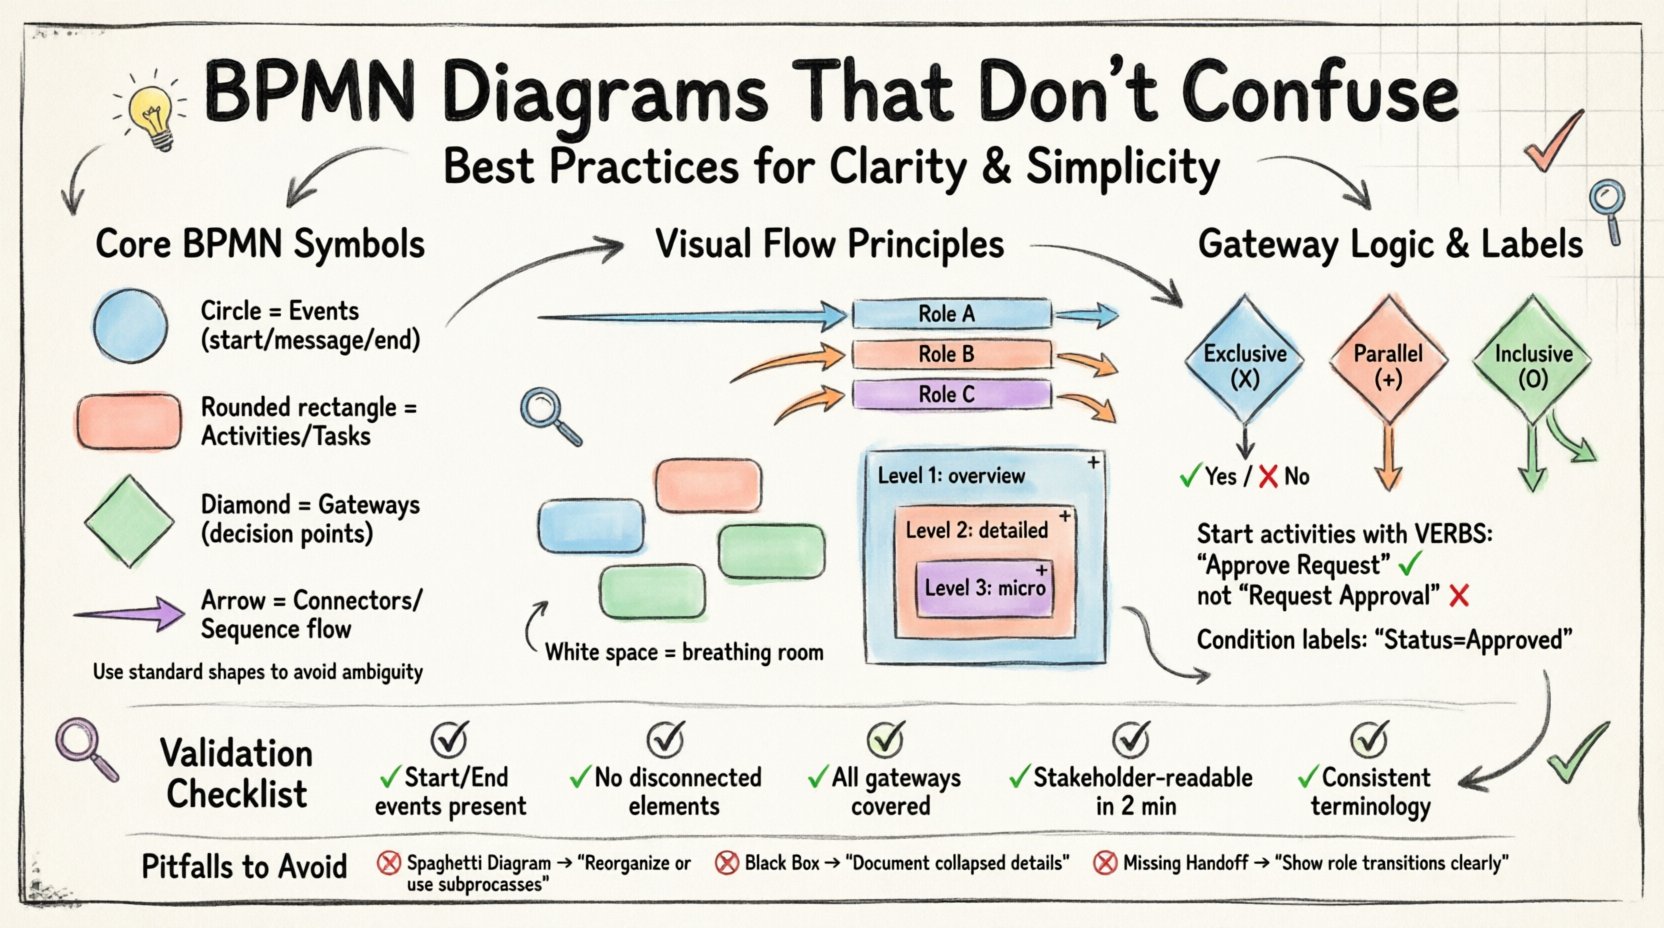
- Events: Represented by circles. They indicate something that happens during the process, such as a start, a message arrival, or a completion.
- Activities: Represented by rounded rectangles. These are the tasks or work performed within the process.
- Gateways: Represented by diamonds. They control the flow of the process, deciding where it goes next based on conditions or logic.
- Connectors: Represented by arrows. They show the sequence of flow between elements.
Using the correct shape for the correct action prevents misinterpretation. For example, a diamond is not a task. If you place a task inside a diamond, the logic of the process breaks. Similarly, a thick black bar for a start event should not be confused with a thick black bar for an end event.
Standard Notation Rules
Adhering to the standard notation ensures that different readers will interpret the diagram the same way. Deviating from the standard creates a private language that only you understand.
- Ensure all events have a single incoming and single outgoing flow unless specified otherwise.
- Keep gateways distinct from activities. Do not place text inside a gateway that describes a task.
- Use dashed lines for message flows and solid lines for sequence flows to distinguish between internal logic and external communication.
2. Managing Complexity with Decomposition 🧩
The most common reason a BPMN diagram becomes confusing is that it tries to do too much at once. A single page should not contain every detail of a complex enterprise system. Decomposition is the practice of breaking a large process into smaller, manageable subprocesses.
The Hierarchy of Detail
Think of your process model like a table of contents. The main diagram provides the overview. Detailed diagrams provide the specifics. This approach keeps the high-level view clean while retaining all necessary information.
- Level 1 (Overview): Shows the major phases and handoffs. Use expanded subprocesses to represent detailed sections.
- Level 2 (Detailed): Expands a specific subprocess from Level 1. Shows every task and decision point.
- Level 3 (Micro): Focuses on a specific task that requires technical detail or strict logic.
When to Collapse a Subprocess
You should use a collapsed subprocess marker (a plus sign) when the internal details are not relevant to the current audience or when the diagram is becoming too crowded. This allows the reader to focus on the flow without getting lost in the weeds.
- Use collapsed subprocesses for standard operations that do not change.
- Use expanded subprocesses for areas where decision logic is critical.
- Ensure every subprocess has a clear trigger and a clear outcome.
3. Layout and Flow Direction 📈
The arrangement of elements on the canvas influences how quickly a reader understands the process. Humans read from left to right and top to bottom. Aligning your diagram with this natural reading pattern reduces friction.
Flow Orientation
Establish a consistent direction for your sequence flows. Do not have arrows pointing in every direction. This creates a chaotic visual experience.
- Top-to-Bottom: Ideal for vertical processes or when space is limited horizontally.
- Left-to-Right: The standard preference for most process models as it aligns with Western reading habits.
Avoid lines that cross over each other unnecessarily. Crossing lines create visual clutter and make it difficult to trace the path from start to finish.
White Space Management
White space is a design element, not empty space. It allows the eye to rest and distinguishes between different logical sections. Crowding elements together implies they are related when they might not be.
- Group related tasks together visually.
- Leave gaps between major phases or swimlanes.
- Use padding around subprocesses to highlight their boundaries.
4. Swimlanes and Responsibility 🔵
Swimlanes (or pools) define who is responsible for each part of the process. Without clear lanes, it is impossible to identify handoffs or accountability. However, too many lanes can make the diagram look like a spreadsheet.
Structuring Pools and Lanes
Organize your lanes logically. Vertical swimlanes are often easier to scan than horizontal ones. Ensure the number of lanes is manageable. If a diagram requires twenty lanes, it is likely not a single process but a collection of processes.
| Structure | Usage | Best Practice |
|---|---|---|
| Pools | Separate organizations or systems | Use only for external boundaries |
| Lanes | Roles or departments | Limit to 3-6 lanes per diagram |
| Subprocesses | Logical grouping | Use to hide complexity |
Handling Cross-Functional Flows
When a process moves from one lane to another, it represents a handoff. These are critical points for errors. Visualize these clearly.
- Ensure the arrow crosses the lane boundary cleanly.
- Label the interaction if it involves a document or message exchange.
- Avoid diagonal lines between lanes; use right angles for clarity.
5. Naming Conventions and Labels 📝
Text is the most important part of a diagram. If the labels are vague, the diagram is useless. Labels should be concise and descriptive.
Activity Naming
Start activity labels with a verb. This indicates action. Avoid nouns like “Invoice” unless it is a data object. Use “Generate Invoice” instead.
- Correct: Review Application, Approve Request, Send Email.
- Incorrect: Application Review, Request Approval, Email Sending.
Condition Labels
nGateways often have outgoing flows with conditions. These labels must be clear and exhaustive. If a process splits, the conditions should cover all possibilities.
- Use Yes/No for binary decisions.
- Use specific values for non-binary decisions (e.g., Status = Approved).
- Avoid vague terms like “Maybe” or “If needed”.
6. Gateway Logic and Control Flow ⚖️
Gateways control the flow of the process. Misusing them creates logic errors that are hard to debug. Understanding the difference between Exclusive and Parallel gateways is essential.
Types of Gateways
| Gateway Type | Symbol | Function |
|---|---|---|
| Exclusive | X inside Diamond | Only one path is taken (OR logic) |
| Parallel | + inside Diamond | All paths are taken simultaneously (AND logic) |
| Inclusive | O inside Diamond | One or more paths are taken (OR logic with selection) |
Avoiding Logic Loops
Infinite loops occur when a process can repeat indefinitely without an exit condition. This is a common error in automation.
- Ensure every loop has a termination condition.
- Use counters for iterative tasks.
- Review the end event to ensure the process actually completes.
7. Visual Consistency and Styling 🎨
Consistency in styling helps the reader focus on the logic rather than the design. While this guide avoids CSS, the visual principles remain the same in any tool.
Line Styles
- Sequence Flow: Solid line with an arrowhead. Use this for the main process path.
- Message Flow: Dashed line with an open arrowhead. Use this for communication between pools.
- Association: Dotted line. Use this to link text annotations or data objects to elements.
Color Usage
Color can be used to denote status or priority, but do not rely on it to convey meaning without a legend.
- Use color sparingly. Too many colors distract from the flow.
- Reserve bright colors for exceptions or error paths.
- Keep the main flow in neutral tones for better readability.
8. Validation and Review Checklist ✅
Before finalizing a diagram, run it through a validation checklist. This ensures the model is robust and ready for implementation.
- Start and End: Does the process start with a Start Event and end with an End Event?
- Flow Continuity: Are there any disconnected elements or orphaned arrows?
- Logic Completeness: Do all gateways have outgoing flows that cover all outcomes?
- Readability: Can a stakeholder explain the process after looking at it for two minutes?
- Naming: Are all labels consistent with the organization’s terminology?
9. Common Pitfalls to Avoid ⛔
Even experienced modelers make mistakes. Recognizing these common errors can save time during the review phase.
The Spaghetti Diagram
This occurs when lines crisscross excessively. It makes tracing the path impossible. To fix this, reorganize the layout or use subprocesses to hide complexity.
The Black Box
This happens when a subprocess is collapsed but no one knows what happens inside. Always document the subprocess separately if the details matter.
The Missing Handoff
This occurs when a task moves from one role to another without a clear transition. Always represent handoffs explicitly to avoid accountability gaps.
10. Iterative Improvement 🔄
Process models are living documents. They change as the business changes. A diagram that was clear last year might be confusing today due to new regulations or systems.
- Schedule regular reviews of your process maps.
- Update labels if terminology changes.
- Refine the layout if the process structure shifts.
Clarity is not a one-time achievement. It requires ongoing attention to detail and a commitment to the reader’s experience. By following these best practices, you create diagrams that facilitate understanding rather than confusion.
Summary of Key Takeaways 💡
- Use standard BPMN symbols correctly to avoid ambiguity.
- Decompose complex processes into manageable subprocesses.
- Maintain a consistent flow direction (Left-to-Right or Top-to-Bottom).
- Limit the number of swimlanes to keep the diagram readable.
- Label activities with verbs and conditions with specific values.
- Validate the logic before sharing the diagram with stakeholders.
- Review and update diagrams regularly to reflect current realities.
By adhering to these principles, you ensure that your BPMN diagrams serve as effective tools for communication and process improvement. The effort spent on clarity pays off in faster implementation and fewer errors during execution.

