


Business Process Model and Notation (BPMN) is the international standard for visualizing business processes. It provides a common language for business stakeholders and technical teams to communicate how work gets done. Whether you are documenting a legacy workflow or designing a new operational strategy, understanding the notation is essential for clarity and efficiency.
This guide walks you through the fundamental steps of creating a business process diagram from scratch. You do not need advanced certification to begin. With a basic understanding of flow control and standard symbols, you can map out complex logic in under 20 minutes. The focus here is on the semantics of the notation, not the specific tool you use to draw it.
📋 Why Standardize Your Process Maps?
Before picking up a pen or opening a canvas, it is important to understand the value of using a standardized notation. Ad-hoc diagrams often lead to misunderstandings. One person might interpret a diamond as a decision, while another sees it as a milestone. BPMN removes this ambiguity through strict definitions.
- Universal Communication: Stakeholders across different departments understand the symbols immediately.
- Gap Analysis: Visualizing the process highlights bottlenecks and redundant steps.
- Automation Ready: A well-structured diagram can often be converted directly into executable workflow logic.
- Consistency: Ensures every process map follows the same visual grammar.
⏱️ The 15-Minute Workflow
Creating a diagram does not require hours of planning. Follow this structured approach to build a functional model efficiently.
Step 1: Define the Scope and Context
Before drawing a single shape, identify the boundaries of your process. A process must have a clear beginning and a clear end. Ask yourself: What triggers this process? What is the final outcome?
- Trigger: An email arrives? A form is submitted? A timer starts?
- Outcome: An order is shipped? A customer is onboarded? A report is generated?
- Participants: Who is involved? Sales, Finance, IT, or the Customer?
Step 2: Sketch the Major Steps (The Skeleton)
Do not worry about details yet. Write down the main actions in chronological order. Use a whiteboard or a piece of paper.
- Receive Request
- Check Availability
- Approve or Reject
- Process Payment
- Send Confirmation
Step 3: Select the Correct Shapes
Translate your written list into BPMN symbols. Each action type has a specific shape. This is where the notation becomes your visual language. You will need to distinguish between events (things that happen), activities (work performed), and gateways (decisions made).
Step 4: Connect the Flow
Draw arrows between the shapes to show the order of operations. Ensure the direction of the arrows flows logically from the start to the end. Avoid crossing lines where possible to maintain readability.
Step 5: Review and Refine
Look at the diagram with fresh eyes. Are there any loops that don’t make sense? Are there tasks that could be parallel? Ensure every path leads to a termination point.
🔑 Core BPMN Elements Explained
To build your diagram accurately, you must understand the three main categories of flow objects. These are the building blocks of every BPMN model.
1. Events
Events are things that happen during the process. They are represented by circles. Events do not consume resources or take time; they signify a point in time.
- Start Event: A circle with a thin border. This is where the process begins.
- End Event: A circle with a thick border. This is where the process concludes.
- Intermediate Event: A circle with a single line border. This happens in the middle of the process, such as receiving a notification or waiting for a time delay.
2. Activities
Activities represent work that is performed. They are represented by rounded rectangles. Activities have duration and require resources.
- Task: The smallest unit of work. It cannot be broken down further in this context.
- Sub-Process: A container for a group of tasks. This allows you to hide complexity and zoom in on details later.
- Call Activity: A reference to a process defined elsewhere.
3. Gateways
Gateways control the divergence and convergence of the sequence flow. They determine how the process moves forward based on logic.
- Exclusive Gateway (XOR): A diamond with an ‘X’. Only one path is taken. Example: Is the customer VIP? Yes or No.
- Inclusive Gateway (OR): A diamond with a circle. Multiple paths can be taken simultaneously. Example: Send email AND send SMS.
- Parallel Gateway (AND): A diamond with a plus sign. All paths are taken at once. This is used for parallel processing.
📊 Symbol Reference Table
Use this table as a quick reference while you model your first diagram.
| Category | Shape | Name | Meaning |
|---|---|---|---|
| Event | ○ (Thin) | Start Event | Process initiation |
| Event | ⬤ (Thick) | End Event | Process termination |
| Event | ○ (Double Line) | Intermediate Event | Pause or notification |
| Activity | ⬜ (Rounded) | Task | Single unit of work |
| Gateway | ◇ (X mark) | Exclusive Gateway | One path only |
| Gateway | ◇ (Plus mark) | Parallel Gateway | All paths simultaneously |
| Data | 📄 (Paper) | Data Object | Information used or produced |
🏗️ Building Your First Diagram: A Concrete Example
Let us apply these concepts to a real-world scenario: Employee Onboarding. We will assume a simplified flow to demonstrate the logic without clutter.
Scenario Details
- Trigger: HR receives a signed offer letter.
- Goal: The employee is ready to start work.
- Participants: HR, IT, and the New Hire.
Diagram Construction Steps
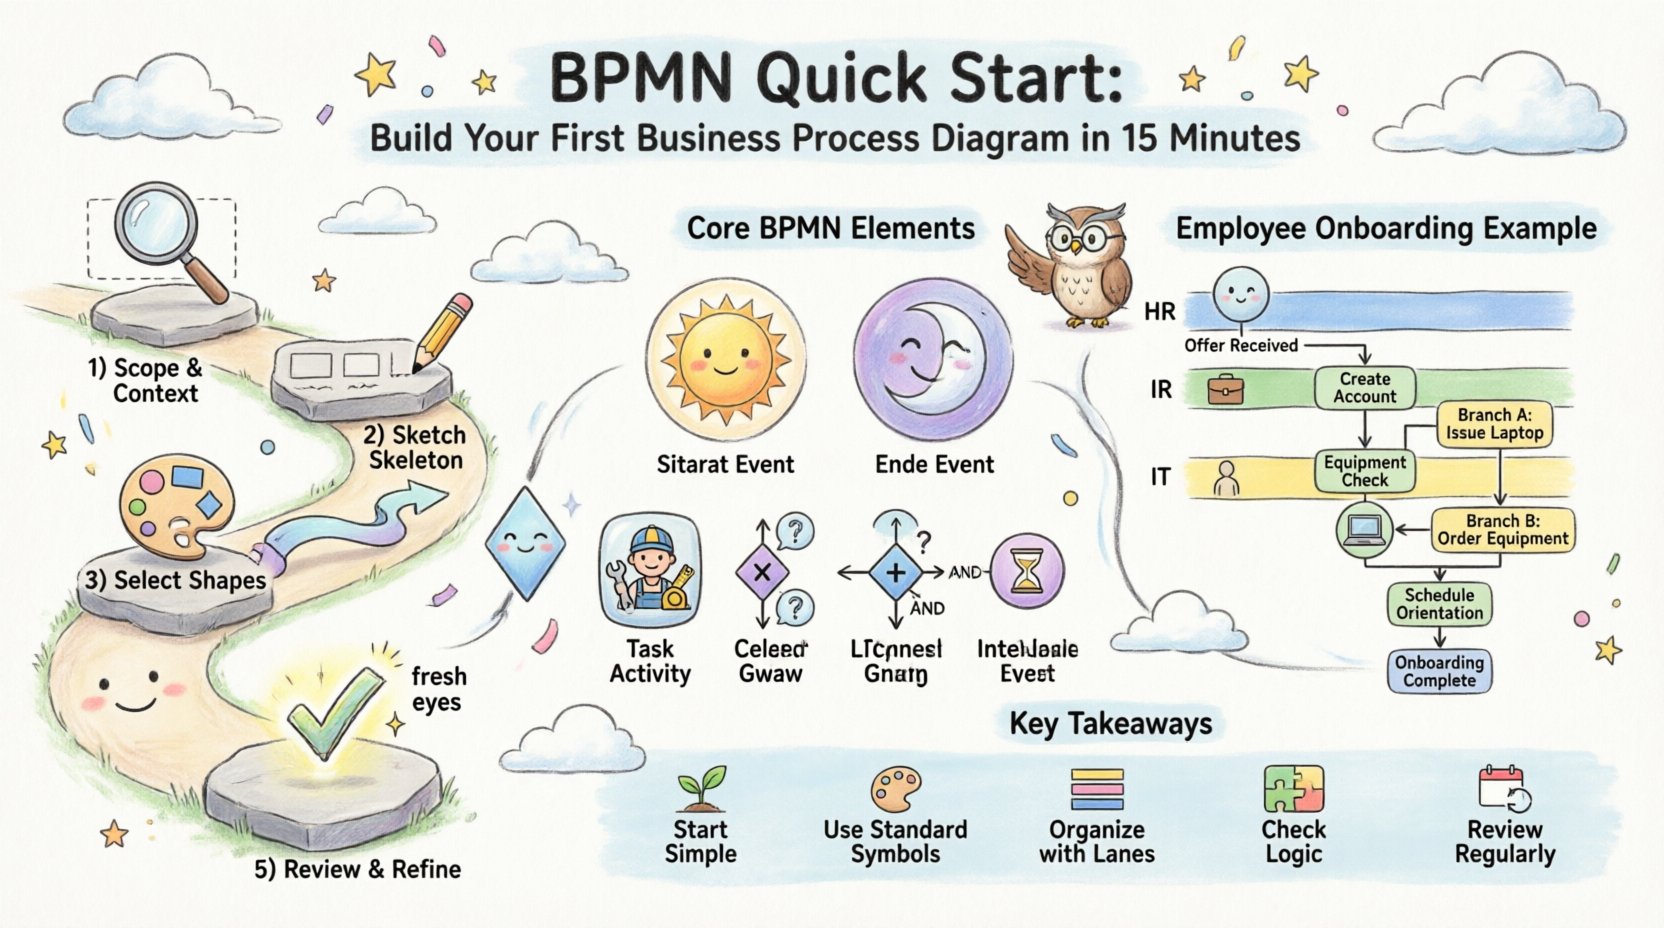
- Start: Place a Start Event. Label it “Offer Letter Received”.
- First Task: Draw a Task connected to the Start. Label it “Create Employee Account”.
- Decision Point: Add an Exclusive Gateway. Ask: “Is Equipment Available?”.
- Branch A (Yes): Connect to a Task “Issue Laptop”. Then connect to “Schedule Orientation”.
- Branch B (No): Connect to a Task “Order Equipment”. Then merge back to “Schedule Orientation”.
- End: Connect “Schedule Orientation” to an End Event labeled “Onboarding Complete”.
Notice how the Exclusive Gateway ensures that only one path is taken based on the equipment status. This logic prevents the employee from being scheduled for orientation without the necessary hardware.
🌐 Pools and Lanes: Managing Complexity
As your process grows, a single line of tasks becomes difficult to read. This is where Pools and Lanes come into play. They organize the diagram by participant or department.
Pools
A Pool represents a distinct participant in the process. It is a large container. If you are modeling a process between two different companies, you would use two Pools. If it is internal, one Pool containing multiple Lanes is standard.
Lanes
Lanes divide the Pool into functional areas. Tasks are placed inside the lane belonging to the responsible party. This makes it clear who does what.
| Element | Visual | Usage |
|---|---|---|
| Pool | Large Rectangle | Represents the Organization or System |
| Lane | Horizontal Strip inside Pool | Represents a Role or Department |
| Message Flow | Dashed Line with Circle Arrow | Connects different Pools (Communication) |
| Sequence Flow | Solid Line with Arrow | Connects tasks within the same Lane |
When drawing, always keep tasks within their assigned lanes. Do not cross lines unnecessarily. If a task requires input from another lane, use a message flow to indicate the handoff.
⚠️ Common Pitfalls to Avoid
Even experienced modelers make mistakes. Avoid these common errors to ensure your diagram remains valid and readable.
- Orphaned Gateways: Never leave a gateway without an incoming or outgoing flow. Every diamond must be connected.
- Parallel Convergence: If you split a flow using a Parallel Gateway (AND), you must merge it back with a Parallel Gateway. Mixing types can cause logic errors.
- Swimlane Confusion: Do not place tasks in the wrong lane. This misrepresents responsibility.
- Too Much Detail: Do not show every single click or sub-step in the main diagram. Use Sub-Processes to hide complexity.
- Crossing Lines: A diagram with spaghetti lines is hard to read. Use orthogonal routing to keep lines straight and right-angled.
💡 Best Practices for Readability
A diagram is a communication tool. If the reader cannot understand it in 30 seconds, it has failed. Follow these guidelines to improve the quality of your work.
1. Keep it Horizontal
Design your flow to move from left to right. This matches the natural reading direction in most Western languages and reduces eye strain.
2. Use Clear Labels
Labels should be concise but descriptive. Avoid single-word labels like “Check”. Use “Check Inventory Availability” instead. If a task takes a long time, indicate the duration if known.
3. Color Coding
While BPMN is black and white by default, using color can help distinguish different types of events or lanes. For example, use red for error paths and green for success paths. Ensure the color scheme is consistent throughout the document.
4. Consistent Spacing
Ensure there is adequate space between shapes. Crowded diagrams are hard to edit and harder to read. Maintain uniform margins around your elements.
📝 Data Objects and Artifacts
Sometimes you need to show that information is being used or created. This is where Data Objects and Artifacts come in.
Data Objects
A Data Object looks like a piece of paper. It shows information flowing into or out of a task. For example, a “Customer Form” might flow into the “Verify Data” task.
Annotations
Use annotations to add notes or comments. These are useful for explaining complex logic or adding references to policy documents. They do not affect the flow of the process but provide context.
Groups
Groups allow you to visually box a set of tasks together without changing the logic. This is helpful for indicating a specific phase of the process, such as “Phase 1: Planning”.
🔍 Validating Your Diagram
Once you have built your model, you must validate it. A diagram that cannot be executed or understood is useless.
- Traceability: Can you trace a path from the Start Event to the End Event without getting stuck?
- Completeness: Are all decision points accounted for? Does every “No” branch have a destination?
- Logic Check: Does the flow match the actual business rules? Ask a subject matter expert to review it.
- Consistency: Are all symbols used correctly according to the standard?
🚀 Moving Forward
Creating your first diagram is just the beginning. BPMN is a vast standard with many advanced features, including timers, compensation handlers, and error boundaries. However, mastering the basics allows you to solve 80% of process modeling challenges.
Continue to practice by mapping out processes from your daily life. How does the morning coffee routine look in BPMN? How does a customer return process work at your local store? The more you draw, the more intuitive the notation becomes.
Remember that the goal is clarity. A complex process does not require a complex diagram. If a diagram is confusing, simplify the process or break it down into smaller sub-processes. The standard is a tool to serve you, not a constraint to limit you.
📚 Summary of Key Takeaways
- Start Simple: Define scope before drawing.
- Use Standard Symbols: Stick to Events, Tasks, and Gateways.
- Organize with Lanes: Assign tasks to the correct roles.
- Check Logic: Ensure all paths lead to an end.
- Review Regularly: Processes change, and so should your diagrams.
By following these steps and adhering to the standard notation, you can produce professional-grade process maps that drive efficiency and understanding across your organization. The ability to visualize work is a powerful skill that pays dividends in time saved and errors avoided.

