


Business Process Model and Notation, commonly known as BPMN, is the universal language used to map out how work gets done within an organization. It acts as a visual blueprint, allowing teams to understand, analyze, and improve workflows without relying on complex technical jargon. Whether you are in management, operations, or IT, understanding the mechanics of BPMN provides clarity where there was once confusion. This guide breaks down the methodology into understandable steps, ensuring you can interpret diagrams and contribute to process improvement effectively.
What Exactly Is BPMN? 🤔
At its core, BPMN is a standard for process modeling. Developed by the Business Process Management Initiative (BPMI), now part of the Object Management Group (OMG), it provides a standardized set of symbols and rules. The goal is simple: create a visual representation of a business process that can be understood by both business stakeholders and technical implementers.
Think of it like a map. If you need to drive from one city to another, you look at a map to see the roads, traffic lights, and destinations. BPMN does the same for work. It shows where a task starts, what happens in the middle, and what the final outcome looks like. It bridges the gap between abstract business ideas and concrete execution steps.
Key characteristics of this notation include:
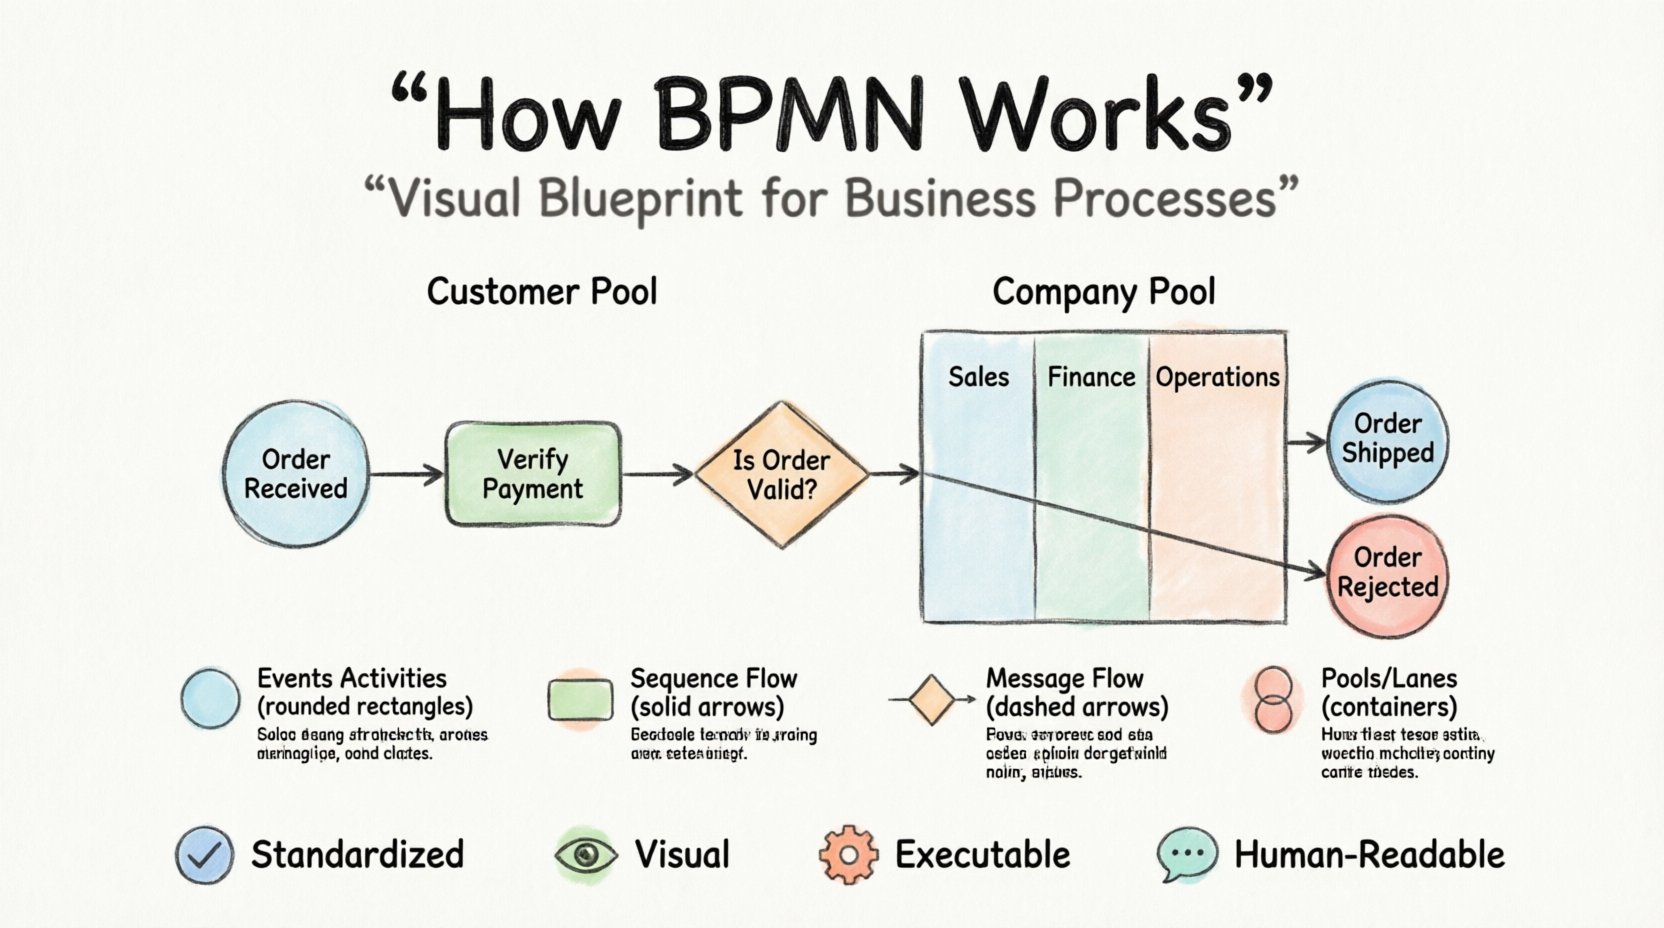
Standardization: Symbols mean the same thing regardless of who draws them.
Visual Clarity: Complex logic is easier to follow when drawn than when written in text.
Execution Capability: The diagrams can often be translated directly into automated workflows.
Human Readability: The notation is designed so that non-technical staff can read and critique the processes.
The Building Blocks of a Diagram 🧱
To understand how BPMN works, you must first learn its vocabulary. The notation is composed of four primary categories of elements: Flow Objects, Connecting Objects, Swimlanes, and Artifacts. Each serves a specific function in defining the logic of the process.
1. Flow Objects: The Action and the State
Flow objects are the main components that make up the movement of the process. They determine what is happening and when.
Events (⭕)
Events are things that happen. They are represented by circles. They mark the start, middle, or end of a process.
Start Event: A thin circle indicating where the process begins. It has no incoming arrows.
Intermediate Event: A thicker circle in the middle of the flow. It represents something happening during the process, like receiving a message or a timer expiring.
End Event: A double-lined circle indicating the process is finished.
Activities (⬜)
Activities are the actual work being done. They are represented by rounded rectangles. This is where the “doing” happens.
Task: A single unit of work. For example, “Approve Invoice” or “Send Email”.
Sub-Process: A container for a set of tasks. It allows you to hide complexity by grouping steps into a single activity. You can open this to see the details if needed.
Gateways (◆)
Gateways control the flow. They determine how the process moves forward based on conditions. They look like diamonds.
Exclusive Gateway: The process must choose one path. Like a traffic light turning red or green. Only one path is taken.
Inclusive Gateway: The process can take multiple paths simultaneously based on conditions.
Parallel Gateway: The process splits into multiple paths that happen at the same time.
2. Connecting Objects: The Path
Connecting objects link the flow objects together. They show the sequence of operations.
Sequence Flow (Solid Arrow): Shows the order of activities. It flows from start to finish.
Message Flow (Dashed Arrow): Shows communication between different participants. It indicates that information is being sent from one entity to another.
3. Swimlanes: Who Does What?
Swimlanes organize the diagram by assigning responsibility. They look like vertical or horizontal containers.
Pools: Represent a distinct participant. A pool often represents a company or an organization.
Lanes: Subdivisions within a pool. They represent departments, roles, or systems within that organization.
Structuring Information: A Symbol Reference Table 📊
To make the visual language easier to digest, here is a structured breakdown of the most common symbols you will encounter.
Element | Shape | Function | Example |
|---|---|---|---|
Start Event | Circle (Thin) | Initiates the process | Order Received |
Task | Rounded Rectangle | Work to be performed | Verify Payment |
Gateway | Diamond | Decision point | Is Order Valid? |
End Event | Circle (Thick) | Terminates the process | Order Shipped |
Sequence Flow | Solid Line + Arrow | Flow of control | Next Step |
Message Flow | Dashed Line + Arrow | Communication | Send Email |
Pool | Large Container | External Participant | Customer Company |
Lane | Sub-Container | Internal Role | Sales Department |
Step-by-Step Walkthrough: Modeling a Process 📝
Creating a BPMN diagram is a logical progression. You do not need to know everything at once. Follow these steps to build a model from scratch.
Step 1: Define the Scope
Before drawing anything, identify what you are modeling. A process model should have a clear beginning and a clear end. Ask these questions:
What triggers the process?
What is the desired outcome?
Who is involved in the process?
What is the boundary of this specific diagram?
For example, if you are modeling an “Employee Onboarding” process, the trigger is “New Hire Hired,” and the outcome is “Employee Active in System.” Everything outside this scope is irrelevant for this specific diagram.
Step 2: Identify the Participants
Draw your Pool and Lanes. This sets the stage for who is responsible for which actions. If the process involves the customer, create a separate Pool for them. If it involves multiple departments, create Lanes within your main Pool.
Step 3: Map the Major Steps
Place the Start Event in the first Lane. Connect it to the first major activity. Work your way down the list of steps. Do not worry about decision points yet. Just get the linear flow of the happy path (the most common scenario) on the page.
Step 4: Add Decision Points
Once the linear flow is established, insert Gateways where conditions apply. For instance, after a loan application is received, a decision must be made: Is the credit score sufficient? If yes, proceed to approval. If no, reject the application. This introduces the branching logic that makes the diagram realistic.
Step 5: Define the End Points
Ensure every path leads to an End Event. A diagram that ends in a void is confusing. Every branch must have a conclusion, whether it is success, failure, or cancellation.
Step 6: Review and Validate
Walk through the diagram as if you were performing the work. Does the logic hold up? Are there any loops that never end? Is every task assigned to a role? This step is crucial for accuracy.
Understanding Flow Logic: The Mechanics of Movement 🏃
The power of BPMN lies in how it handles complexity. It distinguishes between simple linear work and complex conditional logic. Understanding the difference between Exclusive and Inclusive gateways is vital for accuracy.
Exclusive Gateways (The “Either/Or” Choice)
These are used when only one path can be taken. Imagine a customer service call. If the customer is a VIP, they go to the Priority Lane. If not, they go to the Standard Lane. These paths are mutually exclusive. The system checks the condition and picks one.
Inclusive Gateways (The “And/Or” Choice)
These allow multiple paths to activate simultaneously. Consider a new product launch. You might need to update the inventory, notify the marketing team, and train the support staff. All three happen because they are all required. An Inclusive Gateway handles this parallel requirement.
Parallel Gateways (The “Split and Merge”)
Parallel gateways are often used to split work into simultaneous streams and then bring them back together. For example, a manager might approve a budget (Task A) while the procurement team orders the equipment (Task B). Both happen at the same time. Once both are complete, the process moves to the next stage (Task C). The Parallel Gateway waits for all incoming paths to finish before proceeding.
The Role of Artifacts and Annotations 📎
Not everything in a process is an action or a decision. Sometimes you need to provide context. This is where Artifacts come in.
Data Objects: Represent information being used or produced. For example, a “Purchase Order” document might be created during a task.
Groups: A visual way to group elements for clarity, without affecting the logic. It looks like a folder.
Annotations: Text notes that provide extra explanation. These are great for clarifying complex rules.
Using these elements helps the diagram tell a complete story, not just a sequence of actions.
Why Use This Methodology? The Benefits 💡
Adopting a standard notation brings tangible value to an organization. It is not just about drawing pictures; it is about communication and efficiency.
1. Reduced Ambiguity
Text descriptions of processes often lead to different interpretations. One person might read “Check Inventory” and think manual counting, while another thinks software verification. A diagram removes this guesswork by showing exactly how the check occurs.
2. Faster Onboarding
New employees can look at a process map to understand their role within the larger workflow. They see where their tasks fit and who sends them work, and who receives their output.
3. Identification of Bottlenecks
When you visualize the flow, inefficiencies become obvious. You might see a task where work piles up, or a decision point that causes delays. It is much harder to spot these issues in a written document.
4. Compliance and Auditability
In regulated industries, you must prove that certain steps are followed. A BPMN diagram serves as a record of the intended process. When audits occur, the diagram provides a clear baseline for what should have happened.
5. Automation Readiness
While this guide focuses on the visual aspect, the notation is built to be machine-readable. If you decide to automate the process later, the diagram provides the logic required to configure workflow engines.
Common Mistakes to Avoid 🚫
Even with a standard, people make errors when modeling. Being aware of these pitfalls will help you maintain high-quality diagrams.
1. The “Spaghetti” Diagram
When a process becomes too complex, lines cross over each other, creating a tangled mess. To avoid this:
Use Sub-Processes to hide complexity.
Split large diagrams into multiple smaller ones.
Organize lanes logically to keep flow linear.
2. Mixing Logic with Data
Do not clutter the flow with data entry details. If a form is filled out, the task is “Complete Form.” The form itself is a Data Object, not a Task. Keep the flow focused on the action.
3. Missing End Events
Ensure every branch of the diagram leads to a conclusion. Dead ends confuse the reader and suggest the process is incomplete.
4. Overusing Gateways
Not every step needs a decision. If a path is always taken, a Gateway is unnecessary. Use Gateways only where a condition actually changes the path.
5. Ignoring the “Happy Path”
It is easy to focus only on errors and exceptions. While important, the diagram should primarily show how the process works when everything goes right. Exceptions can be handled in separate diagrams or clearly marked branches.
Collaboration and Maintenance 🔗
A diagram is not a one-time deliverable. It is a living document. Business processes change over time. New regulations are introduced, software updates occur, and team structures shift. Therefore, the model must be maintained.
Version Control
Always keep track of versions. If a process changes, save the old version before making edits. This ensures you can revert if necessary and understand the history of changes.
Stakeholder Feedback
Do not model in a vacuum. Share the diagram with the people who actually do the work. They will spot logical errors that a designer might miss. Their feedback is essential for accuracy.
Regular Reviews
Schedule periodic reviews of your process models. Ask: Is this still accurate? Has the workload changed? Are the roles defined correctly? Regular maintenance keeps the model relevant.
Conclusion: A Tool for Clarity ✅
BPMN is a practical tool for organizing thought and action. It transforms abstract business ideas into concrete visual structures. By understanding the symbols, the flow, and the logic, you gain the ability to communicate complex workflows effectively. It empowers teams to see the big picture while understanding the details of daily operations. Whether you are optimizing a current workflow or designing a new one, the discipline of BPMN provides a solid foundation for success.
The journey to process mastery begins with understanding the basics. Start with the symbols, practice with simple scenarios, and gradually build complexity. With time, the notation becomes second nature, serving as a reliable framework for business improvement.

