Business Process Model and Notation, commonly known as BPMN, is the standard language for visualizing processes. It bridges the gap between business stakeholders and technical teams by providing a graphical notation that is both readable by humans and executable by machines. For anyone entering the field of process management, understanding the foundational building blocks is critical. Without a solid grasp of these components, diagrams become confusing and lose their value as communication tools.
This guide breaks down the five essential elements required to construct a valid BPMN diagram. We will explore the semantics of each component, how they interact, and why they matter in a practical workflow context. No jargon without explanation, no marketing fluff, just the structural facts you need to start modeling effectively.
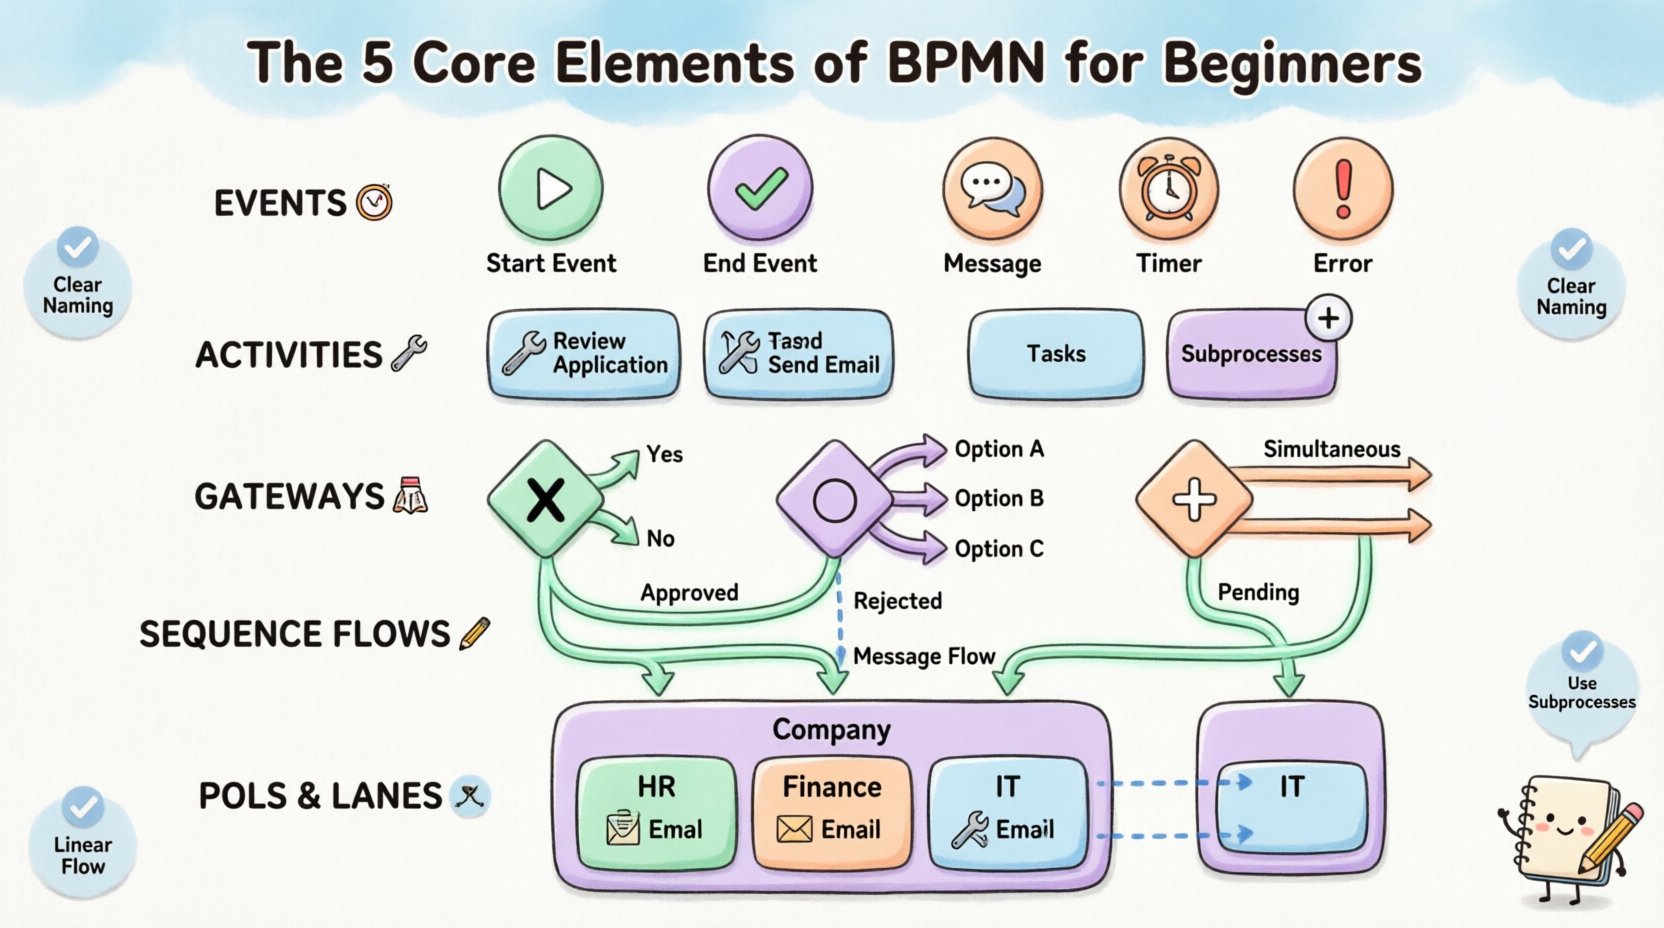
1. Events: The Triggers of Your Process ⏱️
Events are the backbone of any business process. They represent something that happens, not something that is done. In BPMN, an event is depicted as a circle. These circles act as the start, middle, and end points of your flow. Understanding events is the first step because every process must begin somewhere and end somewhere.
Start Events
A Start Event indicates the initiation of a process. It is an empty circle. When a process begins, it waits for a specific trigger. This trigger could be a manual action, a timer, or an incoming message. For example, a process might start when a customer submits an order form. In the diagram, this is the entry point where the flow becomes active.
End Events
An End Event signifies the termination of a process. It is also a circle, but it is filled with a thick border. Unlike Start Events, End Events do not have outgoing sequence flows. Once the flow reaches an End Event, the specific instance of that process instance is complete. A process can have multiple End Events, representing different outcomes, such as “Order Completed” or “Order Cancelled”.
Intermediate Events
Intermediate Events occur between the Start and End events. They are circles with a single thin border. These events represent something that happens during the process lifecycle. Common types include:
- Message Events: Waiting for a message from an external system or participant.
- Timer Events: Waiting for a specific time or duration to pass.
- Error Events: Triggered when a specific exception occurs.
Intermediate events are crucial for modeling waits and interruptions. They show that the process is not just a straight line but has pauses or dependencies on external factors.
2. Activities: The Work Being Done 🛠️
Once an event triggers a process, work must occur. This is where Activities come in. Activities are represented by rounded rectangles. They describe the actual tasks or actions performed within the process. Unlike events, activities consume time and resources.
Tasks
A Task is the smallest unit of work. It is atomic, meaning it is a single step that cannot be broken down further in the context of the current diagram. Tasks are typically assigned to a specific role or system. Examples include “Review Application,” “Send Email,” or “Approve Invoice.” If a step involves multiple sub-steps that are too detailed for this level of the diagram, it is better to group them into a Subprocess.
Subprocesses
Subprocesses allow you to zoom in on a specific area of complexity. Instead of cluttering the main diagram with detailed tasks, you can collapse a group of activities into a single rounded rectangle with a small plus sign. This is called an Expanded Subprocess. Alternatively, it can be collapsed into a flat rectangle with a plus sign to show that it contains internal logic that is hidden at this level.
Using Subprocesses is a best practice for managing complexity. It keeps the high-level view clean while allowing stakeholders to drill down into specific areas when necessary. It supports different levels of abstraction, ensuring the diagram remains readable regardless of the audience’s technical depth.
3. Gateways: The Logic and Decisions 🚦
Real-world processes are rarely linear. They involve decisions, branching paths, and synchronization. Gateways are the diamonds used to model this logic. They do not represent work; they represent the control flow. They determine which path the process takes next based on specific conditions.
There are several types of Gateways, but the most common ones are Exclusive, Inclusive, and Parallel. Understanding the difference is vital for accurate process mapping.
| Gateway Type | Symbol Shape | Function | Example |
|---|---|---|---|
| Exclusive Gateway (XOR) | Diamond with an ‘X’ | Only one path is taken. | Is the credit card valid? Yes or No. |
| Inclusive Gateway (OR) | Diamond with a circle | One or more paths can be taken. | Send email AND SMS to user. |
| Parallel Gateway (AND) | Diamond with a plus | All paths are taken simultaneously. | Process order and send invoice at same time. |
Exclusive Gateways
The Exclusive Gateway ensures that only one outgoing sequence flow is selected. It is often used for binary decisions. If condition A is met, flow goes left. If not, flow goes right. The condition must be mutually exclusive. This is the most common type of decision point in business processes.
Parallel Gateways
A Parallel Gateway splits the flow into multiple paths that happen at the same time. It also acts as a synchronizer. If the process reaches a Parallel Gateway at the end, it waits until all incoming paths are complete before continuing. This is essential for modeling concurrent activities, such as notifying HR and IT simultaneously after an employee leaves.
Inclusive Gateways
Inclusive Gateways allow for multiple paths to be active if multiple conditions are met. Unlike the Exclusive Gateway, which forces a choice between A or B, the Inclusive Gateway allows for A, B, or A and B. This is useful for complex conditional logic where options are not mutually exclusive.
4. Sequence Flows: The Path of Execution 🛤️
Sequence Flows connect the various elements together. They are solid arrows that define the order of execution. Without Sequence Flows, the diagram is just a collection of shapes. The arrow points from the source (like an Event or Activity) to the target (another Event, Activity, or Gateway).
It is important to distinguish between Sequence Flows and Message Flows. Sequence Flows represent the internal flow of control within a single process instance. They show what happens next inside the organization’s boundary. Message Flows, which are dashed arrows, represent communication between different participants or pools. Confusing these two is a common error for beginners.
When modeling Sequence Flows, keep these principles in mind:
- Directionality: Always point in the direction of execution. The flow should be easy to trace from top to bottom or left to right.
- Connectivity: Ensure every element has a clear path to the next. Avoid orphans where a shape has no input or output.
- Condition Labels: When multiple flows leave a Gateway, label the paths with the conditions (e.g., “Approved”, “Rejected”). This removes ambiguity.
Complex flows often lead to spaghetti diagrams. To avoid this, try to keep the flow linear where possible. Use sub-processes to group complex logic, and use gateways sparingly. If a diagram looks like a tangled web, it is likely too detailed for the intended audience.
5. Pools and Lanes: The Organization of Responsibility 🏢
Processes rarely happen in a vacuum. They involve multiple departments, systems, or external partners. Pools and Lanes provide the visual container for these participants.
Pools
A Pool represents a participant in the process. It is a large rectangle. A Pool can contain multiple Lanes. Each Pool represents a distinct boundary, such as a company, a department, or an external customer. For example, in an order fulfillment process, you might have a Pool for “Internal Company” and a Pool for “Customer”. Events crossing the boundary between two Pools are typically Message Flows.
Lanes
Lanes are subdivisions within a Pool. They represent specific roles, departments, or systems responsible for the activities inside them. If a Pool represents the “HR Department”, a Lane might represent “Recruiting” and another “Payroll”. Activities are placed in the Lane of the role responsible for them.
This structure clarifies accountability. When a process is reviewed, stakeholders can immediately see who is responsible for each step. It also helps in identifying handoffs. A handoff occurs when the flow moves from one Lane to another. These are critical points for potential errors or delays.
Message Flows Across Pools
When a process involves multiple Pools, communication must cross the boundary. This is done via Message Flows. Unlike Sequence Flows, Message Flows cannot cross Lane boundaries within the same Pool. They must cross Pool boundaries. This enforces the rule that direct control flow is internal, while communication is external.
Best Practices for Clean Modeling ✅
Knowing the elements is only half the battle. Applying them correctly ensures the diagram is useful. Here are some guidelines to maintain clarity and consistency.
- Consistent Naming: Use clear, verb-noun phrases for Activities (e.g., “Review Document” instead of “Review”). Name your Events and Gateways clearly to reflect their purpose.
- One Flow per Path: Try to avoid having multiple Sequence Flows between the same two shapes. If you have multiple paths, use Gateways to separate them.
- Horizontal and Vertical Flow: Orient your diagram so the flow is generally top-to-bottom or left-to-right. Avoid sharp turns and zig-zags where possible.
- Use Standard Colors: While BPMN is black and white by default, many tools use color coding for events (e.g., green for success, red for error). Ensure you understand the legend if you use color.
- Keep it Simple: If a diagram has too many elements, split it. A single diagram should ideally fit on one screen or one sheet of paper. Use Subprocesses to hide complexity.
Common Pitfalls to Avoid 🚫
Even experienced modelers make mistakes. Being aware of common errors can save time during reviews.
- Missing End Events: Every process path must lead to an End Event. If a flow stops at a Task without an End Event, the process instance is considered incomplete or stuck.
- Disconnected Elements: Ensure every shape is connected. Isolated tasks or events indicate a broken model.
- Overuse of Gateways: Do not use a Gateway for every single decision. If the logic is simple, a direct path with a label is often sufficient. Gateways add visual complexity.
- Confusing Pools and Lanes: Remember that Message Flows cross Pools, while Sequence Flows cross Lanes. Using a Message Flow to connect two tasks in the same Lane is incorrect.
- Ignoring Exception Flows: Business processes often go wrong. Use Intermediate Error Events to show what happens when a failure occurs, rather than assuming everything goes right.
Final Thoughts on Process Standardization 📝
Mastering these five elements provides a strong foundation for business process modeling. BPMN is not just about drawing diagrams; it is about creating a shared understanding of how work gets done. When everyone speaks the same visual language, communication improves, inefficiencies are spotted faster, and digital transformation becomes more feasible.
Start by modeling simple processes. Focus on getting the Events, Activities, and Flows correct. As you become comfortable, introduce Gateways and Lanes. The goal is clarity, not complexity. A good BPMN diagram tells a story that anyone can read, regardless of their technical background. By adhering to the standard rules and avoiding common pitfalls, you ensure your models are robust, accurate, and valuable assets for the organization.

